Profitable Trading Strategy Step-by-Step
This guide walks you through one complete trading workflow that you can follow from start to finish.
It's a repeatable concrete method of how TradingView indicators can be applied in practice to work toward profitability and consistency.
You can use this workflow on any asset available on TradingView—forex, stocks, or cryptocurrencies.
By the end, you'll understand:
- How to build a repeatable process that works for you
- Why your wins are the result of skill and discipline, not luck
- Why your losses happen, how to learn from them and minimize their impact
Why Trading Is Worth It
Trading has the potential to be life-changing—with the right knowledge, discipline, and risk management.
For some, it's an additional income stream; for others, it becomes a replacement for a full-time job.
Real success stories shared in our Discord community include:
- A trader covered the cost of a new business van in just one week.
- Another earned the monthly salary of an IT manager from a single trade.
- Another is covering living expenses for their entire family through consistent trading profits.
These results don't come from luck, but from discipline and persistence—and they can absolutely be learned.
Success takes time—but with consistency, progress compounds into freedom.
Join the Community
All of the profit examples below come directly from our Discord community.
👉 Join here to learn, share, and grow together.
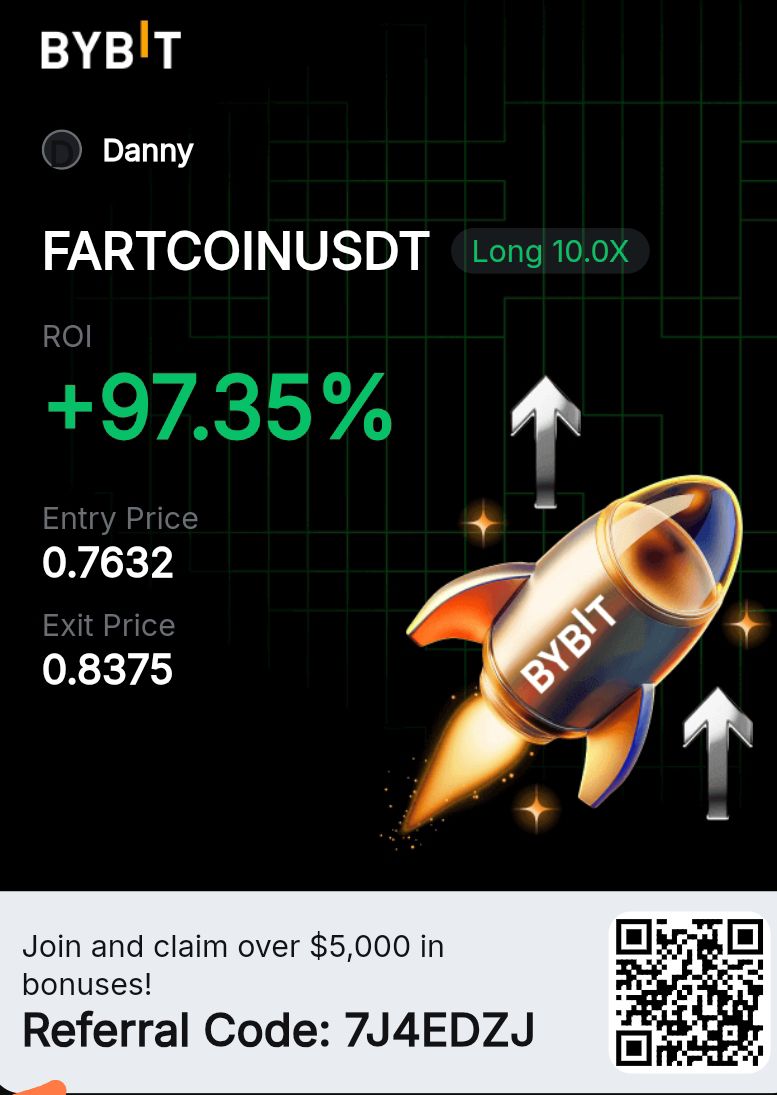
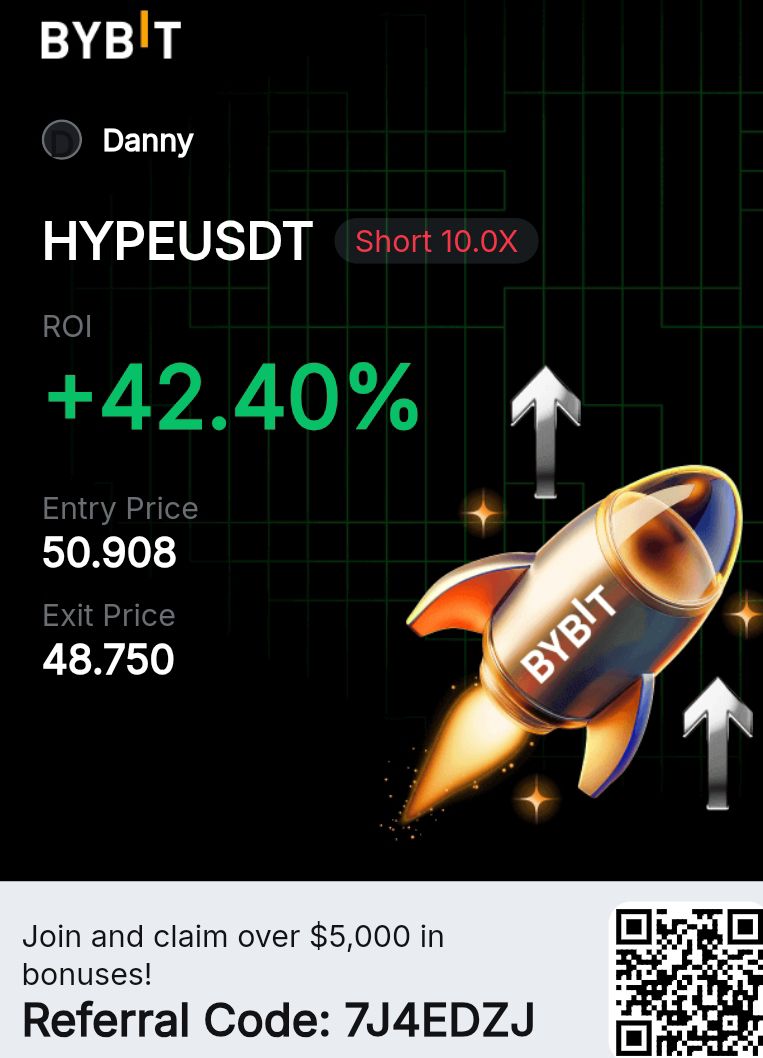
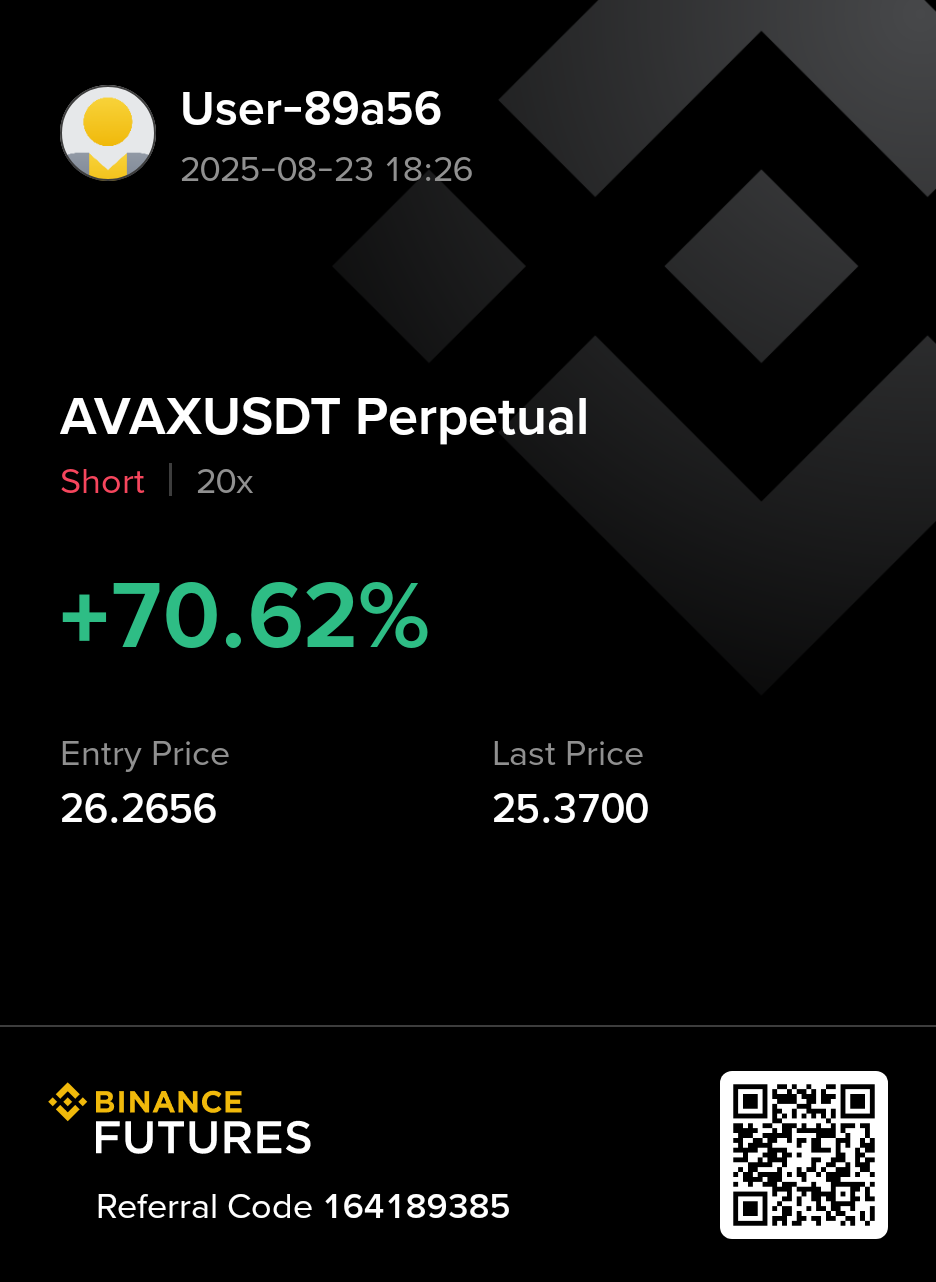
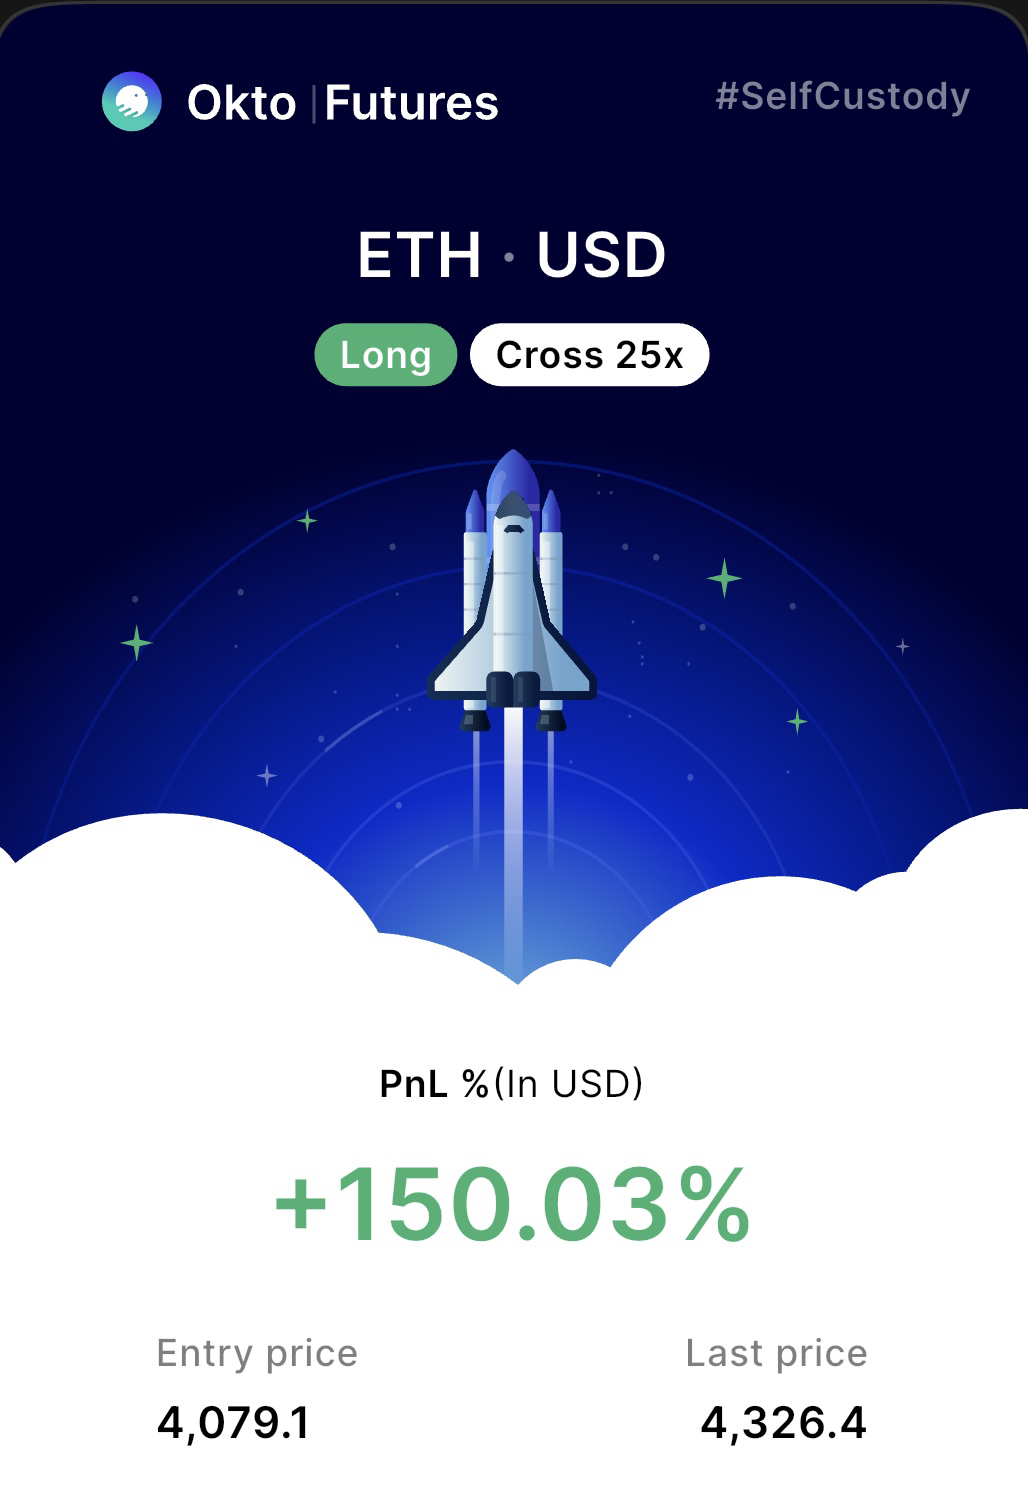
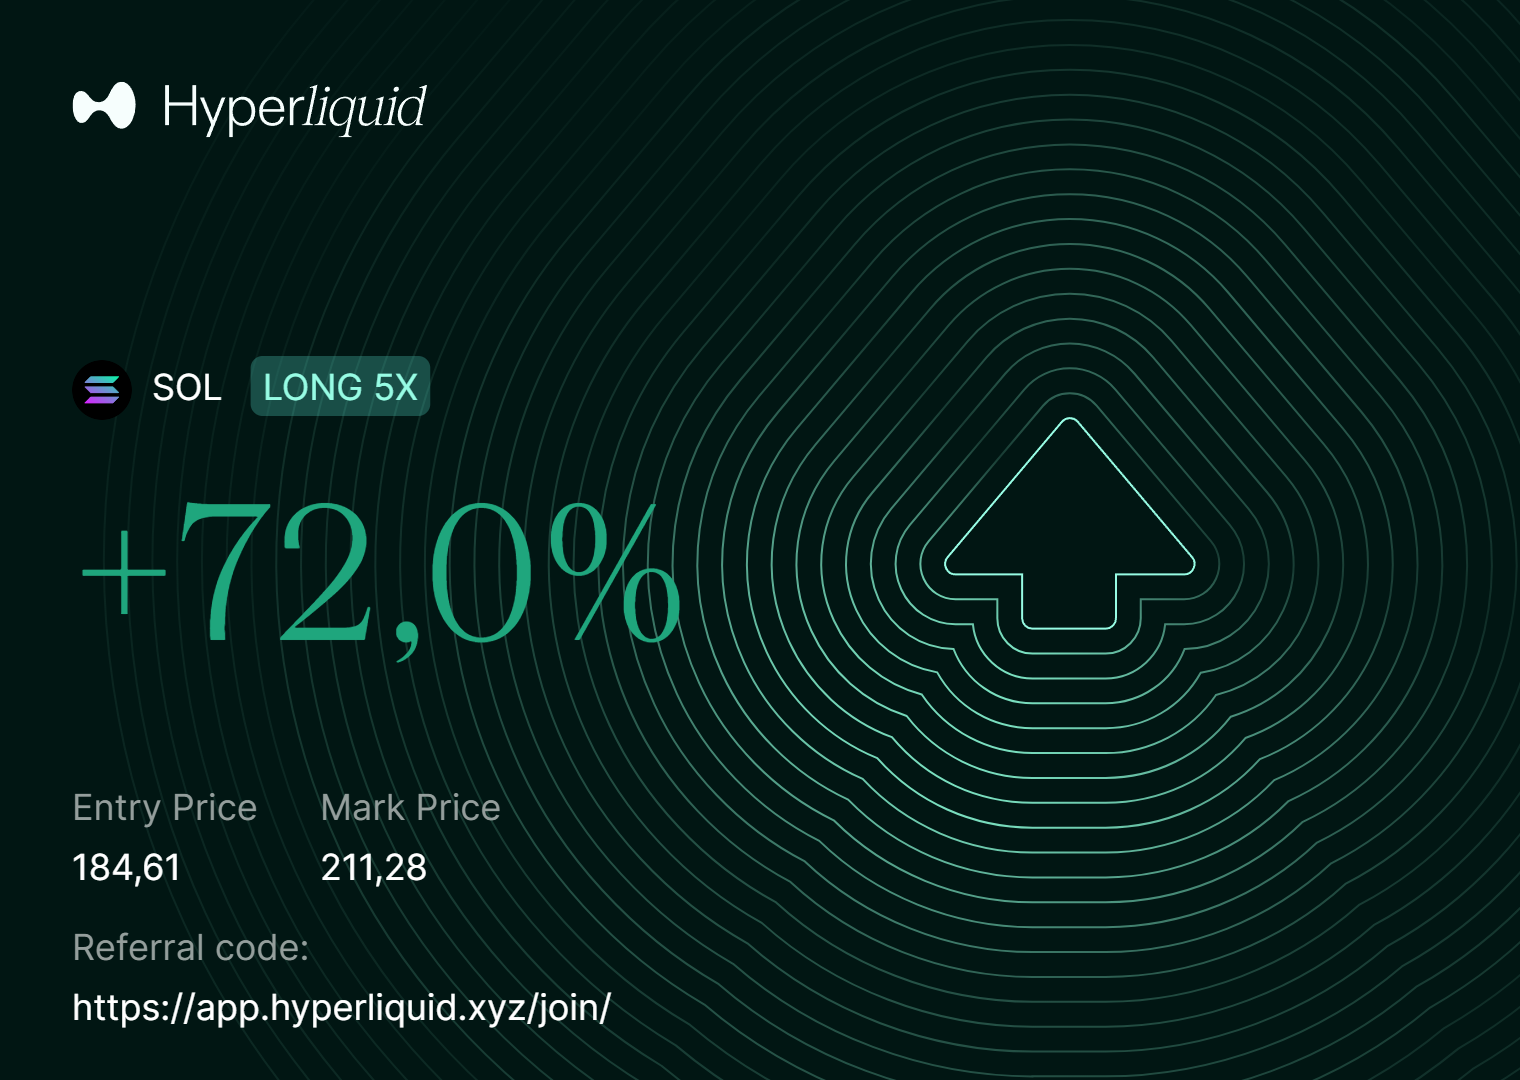
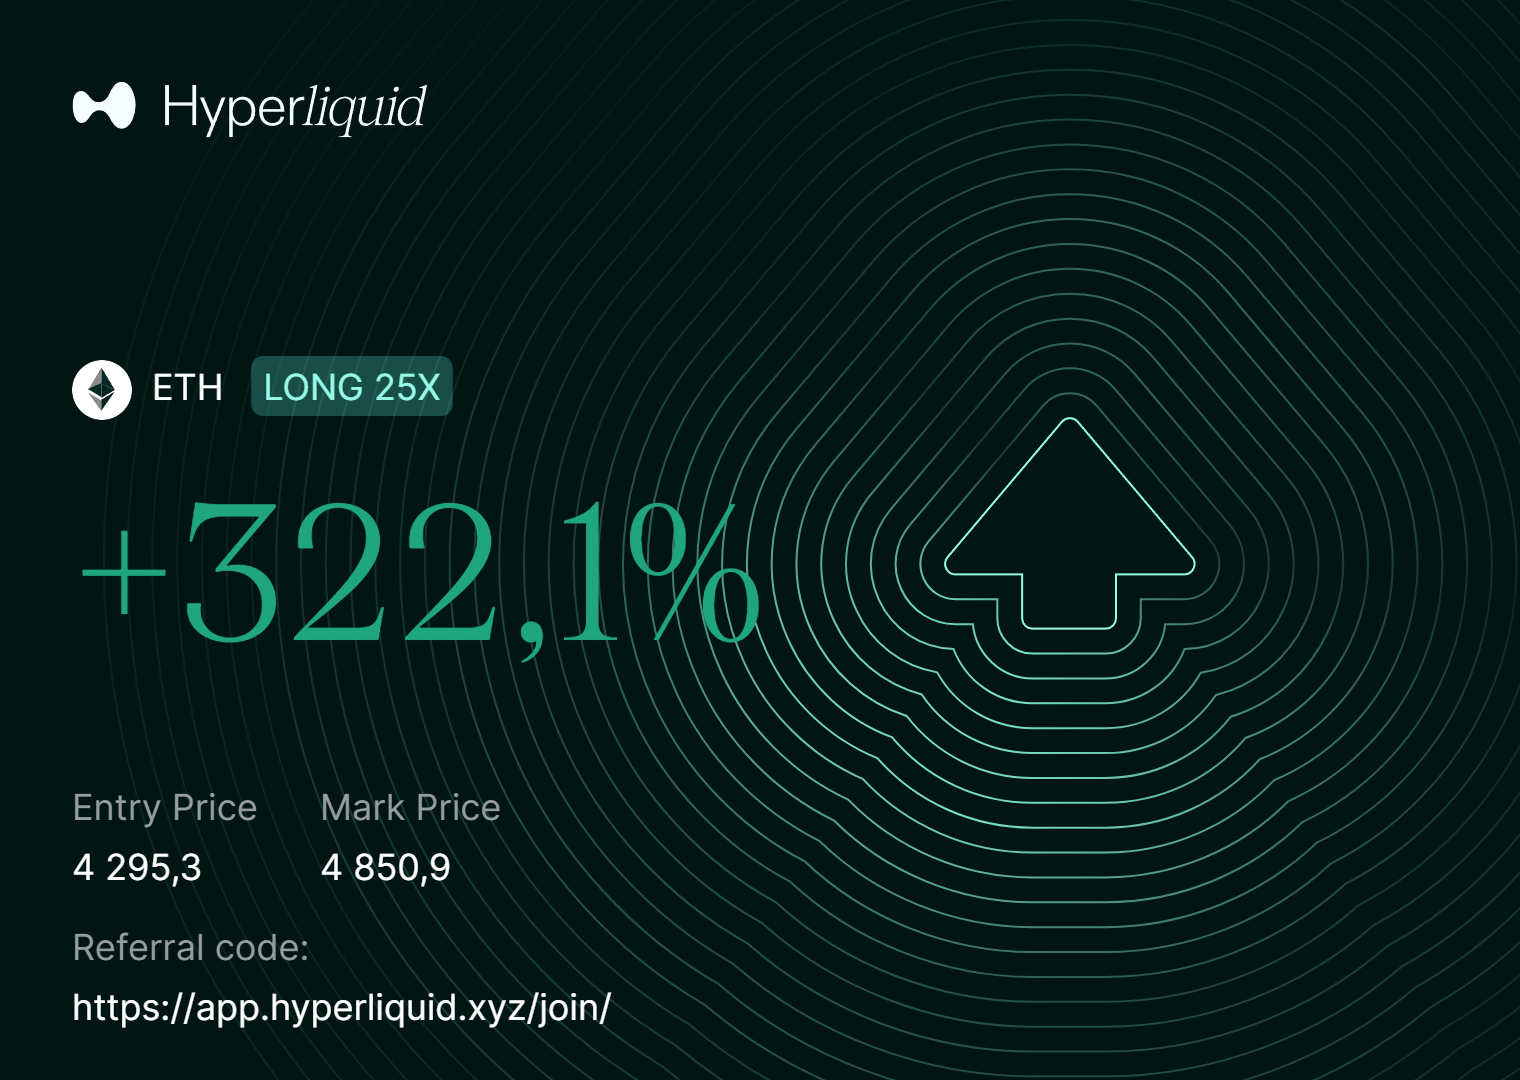
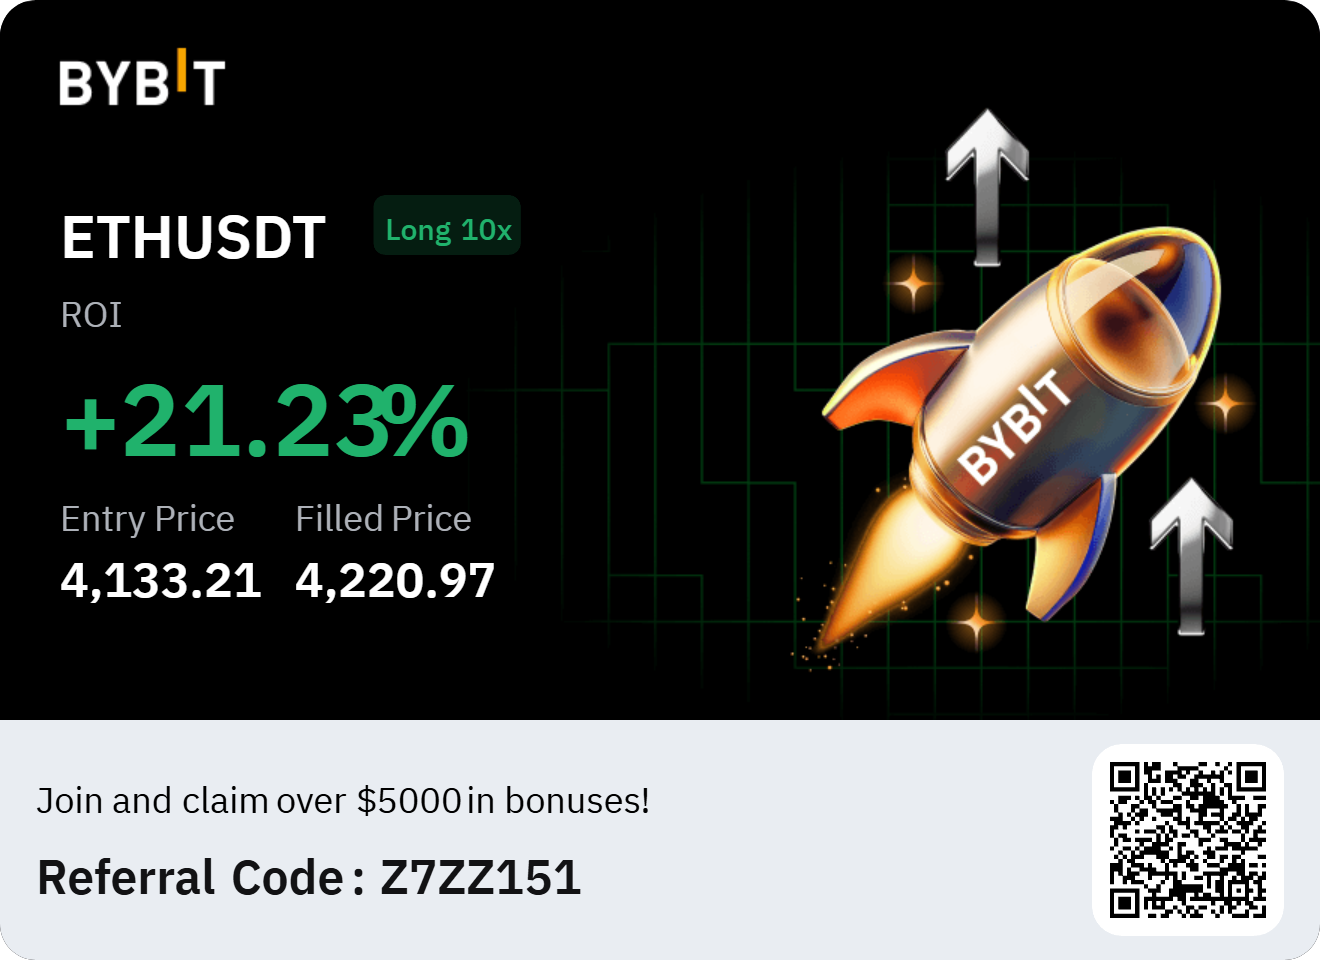
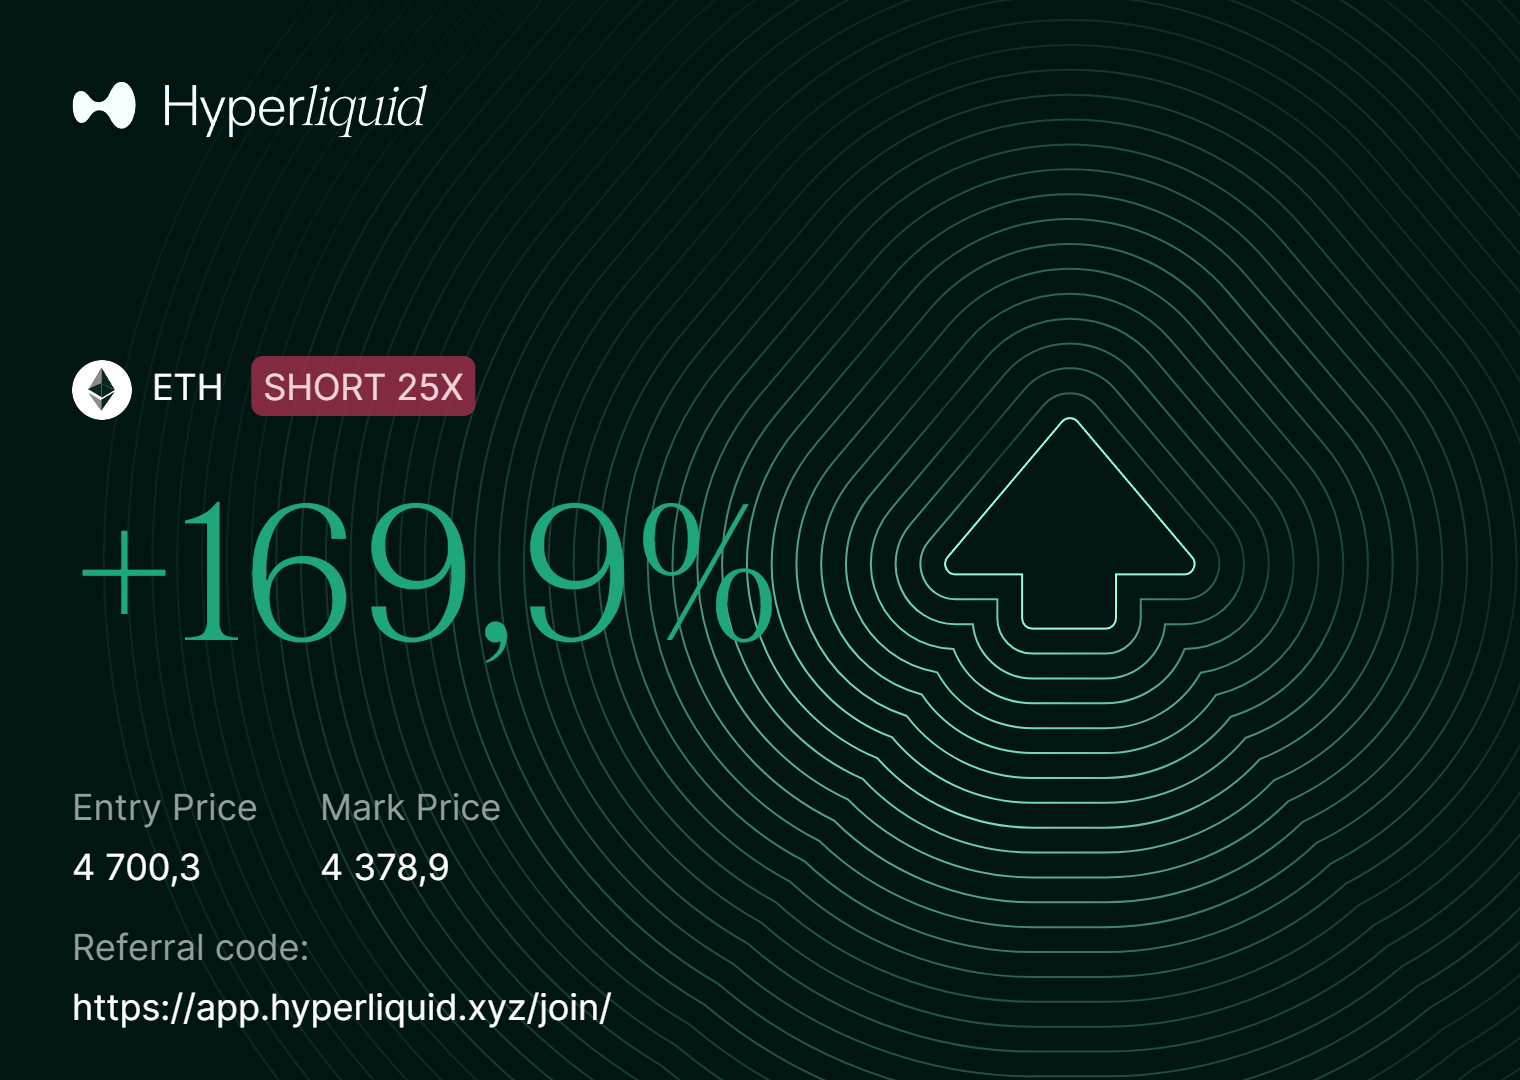
These examples show what can be achieved, not what will happen for everyone.
Your journey will depend on your risk management, psychology, and ability to learn from both wins and losses.
But don't worry, we will cover all aspects in this guide.
How to Use This Guide
If you already have a strategy that works for you, we strongly recommend that you do not abandon or replace it.
Instead, treat this guide as an educational resource or an additional perspective that may help refine your existing approach.
This document is designed to be read from top to bottom.
Do not skip sections, even if you think you already understand them.
If something feels unclear, read the entire guide through once, then come back and read it again.
Repeat this process as needed, giving yourself breaks in between (even a full day) to let the knowledge sink in.
Trading is not learned in a single sitting.
Approach this guide with patience—the more times you revisit it, the deeper your understanding will become.
This is a practical guide. If you're looking for shortcuts or “buy/sell” signals, you won't find them here.
What you'll gain is a structured process and a trading skill that will stay with you for life.
Table of Contents
- Risk Management
- Manage Your Expectations
- Trading Prerequisites
- Core Trading Principles
- LTF Day Trading / Scalping Strategy
- Conclusion
- Cheat Sheet
- Disclaimer
Trading involves risk. This guide is educational only—not financial advice.
See the full disclaimer at the end of this page.
Risk Management
Before we dive into technical setups, it's essential to understand risk management.
Risk management is the practice of protecting your trading capital and ensuring that one bad trade (or even a series of bad trades) does not wipe out your account.
What Risk Management Is:
- Controlling the size of your positions relative to your account balance
- Using stop-loss orders to limit potential losses
- Managing leverage intelligently so that a single trade doesn't put your entire account at risk
- Ensuring you only trade with money you can afford to lose without financial or emotional harm
What Risk Management Is Not:
- A guarantee of profits
- A way to eliminate all risk
- Something optional that only beginners need
- Blindly following “1% rule” or other formulas without understanding your own risk tolerance
Why Risk Management Is Necessary
Even the best trading setups fail. Markets can gap, news can hit unexpectedly, and indicators can give false signals.
Without risk management, a single trade could erase weeks or months of gains—or worse, wipe your account entirely.
By managing risk, you are not trying to avoid losses. Losses are a normal part of trading.
Instead, you are making sure that losses are small and survivable, while wins have the potential to grow your account.
Example: Full Margin Trading
Imagine a trader who decides to use their full account balance with high leverage on a single trade.
This approach can be viewed in two ways:
- Bad (most of the time): If the trader does not understand the risk, one wrong move could liquidate the account instantly. This is usually reckless and unsustainable.
- Potentially Valid (but not recommended): If the trader does understand the risk and has other accounts or backup capital, then losing that single account may fit into their broader strategy.
For example, someone could operate 10 accounts, each treated as a separate risk bucket. Even if one account is lost, the others remain intact.
This is not good risk management in the traditional sense, but it highlights an important truth:
Risk management is about making conscious, informed decisions, not blindly following one set of rules.
Position Sizing and Leverage
Leverage is often misunderstood. It is not inherently dangerous—it depends on how it is used.
For example:
- A trader with a $100 account could use 1x leverage and place a single $100 position.
- Alternatively, they could use 20x leverage, but commit only $2 of their own margin per position, opening 3-4 positions.
- If paired with well-placed stop losses, the second approach can actually be less risky, because only a fraction of the account balance is tied to each trade.
The key is not the leverage number itself, but how position size, margin allocation, and stop-loss placement work together.
Example of Good Risk Management Using a Leverage
A trader has a $1,000 account:
- They risk 1% per trade → maximum $10 loss if stopped out.
- They use 10x leverage, but only put $100 margin into a $1,000 position.
- Their stop-loss is placed logically (above/below a range boundary).
- If the stop is hit, they lose $10, not the whole account.
This is how leverage becomes a tool: used carefully, it allows flexibility without exposing the entire balance.
The trader can lose 10 trades in a row and still have 90% of the account left.
Common Myths About Risk Management
-
“Leverage is always bad.”
→ Wrong. Leverage magnifies both gains and losses. Used responsibly with small position sizes, it can actually help manage margin efficiently. -
“Stop-losses are optional.”
→ Wrong. Not having a stop-loss is essentially gambling that the market will reverse in your favor. Even professional traders always define exit levels. -
“Risk management limits profits.”
→ Wrong. Proper risk management may reduce the size of individual wins, but it enables you to survive long enough to realize consistent gains over time. -
“I can recover from any loss if I double down.”
→ Dangerous myth. This is the classic “martingale” trap. If you keep increasing position size after losses, eventually one streak will blow up your account.
Irrational Markets vs. Your Solvency
There is an old saying in trading:
“The market can stay irrational longer than you can stay solvent.”
This means that:
- Just because a move looks “too high” or “too low” doesn't mean it has to reverse right now
- You can be 100% correct in your analysis, but if your position is oversized or unprotected, the market can wipe you out before the move happens
- Logic and fundamentals do not protect you against liquidation
This is exactly why risk management exists:
You don't need to predict the exact moment of reversal—you just need to survive long enough for probabilities to play out in your favor.
Key Takeaways
- Always know your maximum risk per trade (commonly 1-2% of account balance for most traders, but entirely up to you if you accept the risk).
- Always use a stop-loss—even if it is a “mental stop,” it must be defined in advance.
- Use leverage as a tool, not a weapon against yourself.
- Only trade with money you can afford to lose.
- Surviving is more important than winning big. The goal is longevity and consistency.
- Never assume the market must turn just because it looks irrational.
⚖️ Final Note: There are many different risk profiles. Some traders take large risks intentionally as part of a broader plan. What matters most is that you understand your own risk, size positions consciously, and never risk money that would harm you if lost.
Manage Your Expectations
One of the most important truths in trading is this: nobody has a 100% win rate.
Even with a profitable strategy, you will face losses. This is not a sign of a bad system, nor does it mean you are doing something wrong. It is simply how markets work.
Losses Are Part of the Game
- Sometimes you will take a textbook-perfect entry with divergence, confluence, and a well-placed stop-loss—and it will still end in a loss.
- News events, sudden liquidity grabs, or random volatility can and will stop you out.
- No indicator, no trader, no algorithm can eliminate losing trades completely.
What Really Matters
The key is not to avoid losses, but to manage them and think in probabilities:
- With proper risk management, a single loss is just a small scratch, not a fatal blow.
- A profitable strategy does not win every trade—it produces long-term positive expectancy.
- Over dozens or hundreds of trades, your edge is what makes you profitable, not any single position.
Think Like a Casino
Casinos don't win because they win every spin of the roulette wheel.
They win because the odds are slightly in their favor—and over time, those odds always play out.
Trading works the same way.
Your goal is not to avoid red numbers on your PnL, but to consistently apply your edge so that, in the long run, your account grows.
Psychology: The Hidden Enemy
Human psychology often works against you in trading:
- Losing a trade feels much worse than winning one feels good
- This imbalance makes you want to “make it back” immediately, leading to revenge trades and poor decisions
So what can you do?
- Treat every new trade as an independent event. The outcome of your last trade should not affect your next one.
- Never try to “chase losses” or force the market to give back what it took.
- If a loss hits harder than it should, take a step back. Sometimes the best trade you can make is to not trade at all for the rest of the day.
Reset and Recharge
Every trader needs a way to reset mentally. For some, that means:
- Taking a walk outside
- Watching an educational video or stream
- Spending time with friends or family
- Hitting the gym
Find what works for you. The goal is to clear your head so you can return to the charts with a calm and focused mindset.
👉 Staring at the chart 24/7 will not make you a better trader—it will only exhaust you and lead to mistakes.
Additional Mindset Principles
-
Trading is not like a regular job.
You can't just “show up” at any convenient time and expect opportunities.
The market doesn't adapt to your schedule—you must adapt to the market's. -
Sometimes trading means waiting.
The right setup may appear during the Asian session, in the middle of the night, or only once every few days.
Patience is part of the process.To minimize wasted screen time, set alerts on your chart:
- Price levels
- Trendlines
- Indicator signals
- Crossings of important levels
This way the market will call you when something important happens.
The more hours you spend staring at charts, the less clearly you see.
Stay sharp, and don't waste energy watching nothing happen. -
No trade is better than a bad trade.
Forcing yourself to trade every day or to hit a fixed profit target will push you into low-quality setups and poor decisions. -
Opportunities are infinite.
Missing a move does not matter—there will always be another one.
In fact, FOMO (fear of missing out) is often a reverse indicator: when you feel it strongly, it usually means it's time to step away. -
Trade what you see, not what you want to see.
Never “front-run” a setup.
If you think a divergence might form or price might break a level, do not enter yet.
Wait for confirmation. Acting early is gambling, not trading.
Losses do not mean you are failing.
What matters is consistency, discipline, and the ability to stick to your plan even after setbacks.
Your job is to control your psychology, reset when needed, and approach every trade fresh.
Consistency and discipline—not perfection—are what make traders profitable in the long run.
Trading Prerequisites
Before you begin following this strategy, there are a few things you'll need in place.
These are not “nice-to-haves”—they are essential for building the right environment and mindset for trading success.
For a more general introduction to ZenAlgo and the platform itself, please see our
Getting Started Guide.
1. Community Support (Absolute Must)
Trading can be a lonely activity, but it doesn't have to be.
Our ZenAlgo Discord is the heart of our community, where traders:
- Share their journey (wins, losses, lessons)
- Discuss trading setups and strategies
- Offer personal support, motivation, and encouragement
Humans are social creatures, and trading becomes much easier (and healthier) when you're surrounded by like-minded individuals.
Don't trade alone—join the community and grow together.
2. Charting Platform
You will need a TradingView account to access charts, indicators, and alerts. Free account can get your started, Plus or Premium TradingView plan is optimal.
👉 You can sign up here: TradingView Pricing
The strategy described in this guide relies on ZenAlgo's custom indicators. As you progress, you'll naturally discover which tools are required. We recommend at least our Gold or Platinum plan. For now, just make sure you have a functional TradingView account.
3. Trading Account (Exchange or Broker)
Finally, you'll need a place to execute trades.
The right choice depends on the market you want to trade:
-
Crypto Exchanges (spot or derivatives):
Popular options include Binance, Coinbase, Hyperliquid, MEXC, and Kraken. -
Forex Brokers:
Established names include OANDA, IG, and FOREX.com. -
Stock Brokers:
Well-known platforms include Interactive Brokers, E*TRADE, and Robinhood.
Choose a provider that fits your region, regulatory requirements, and personal preference.
Always make sure your broker or exchange is reputable and secure.
Quick Recap
- ✅ Join the Discord community
- ✅ Create a TradingView account
- ✅ Open a trading account with a reliable crypto exchange or forex broker
Once you have these three pillars—community, charts, and an exchange—you're ready to move on to the strategy itself.
Core Trading Principles
Before diving into the actual strategy, you need to understand several core principles that form the foundation of trading with ZenAlgo indicators.
These are not optional tips—they are rules of thumb and insights that will help you interpret the market correctly.
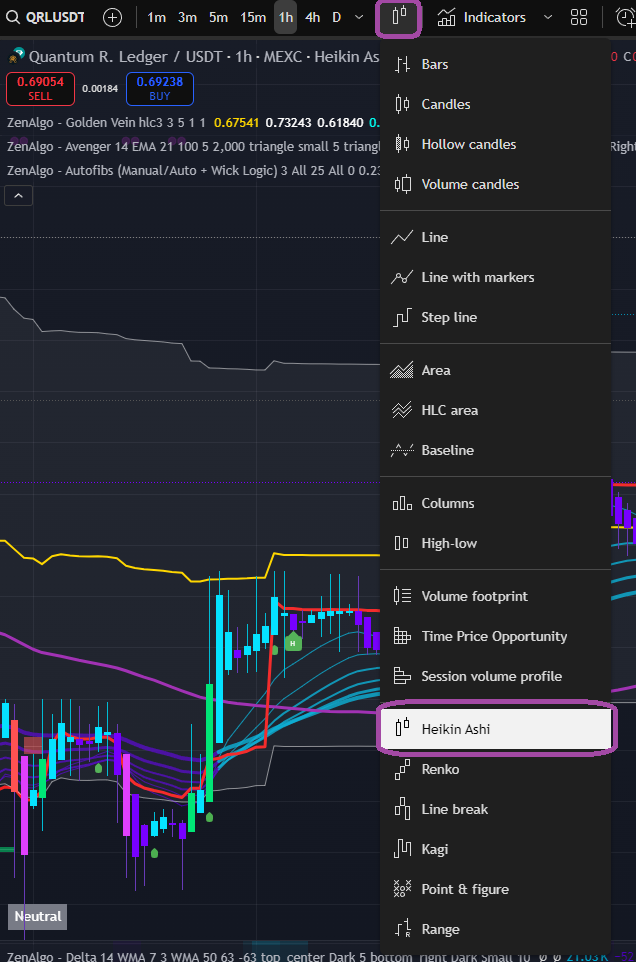
Heikin Ashi Candles
Our indicators work best with Heikin Ashi (HA) candles.
The reason is simple: HA candles automatically smooth out market noise, making it easier to:
- Identify the dominant trend
- Spot clear reversals
- Filter out random price spikes
While Heikin Ashi does have limitations (e.g., exact highs and lows are less precise), the benefits far outweigh the drawbacks when used for strategy execution.
👉 For a deeper dive into pros and cons, see our full guide: Heikin Ashi Candles
Always switch your charts to Heikin Ashi when trading with ZenAlgo indicators. Make sure this setting is applied in every new layout.
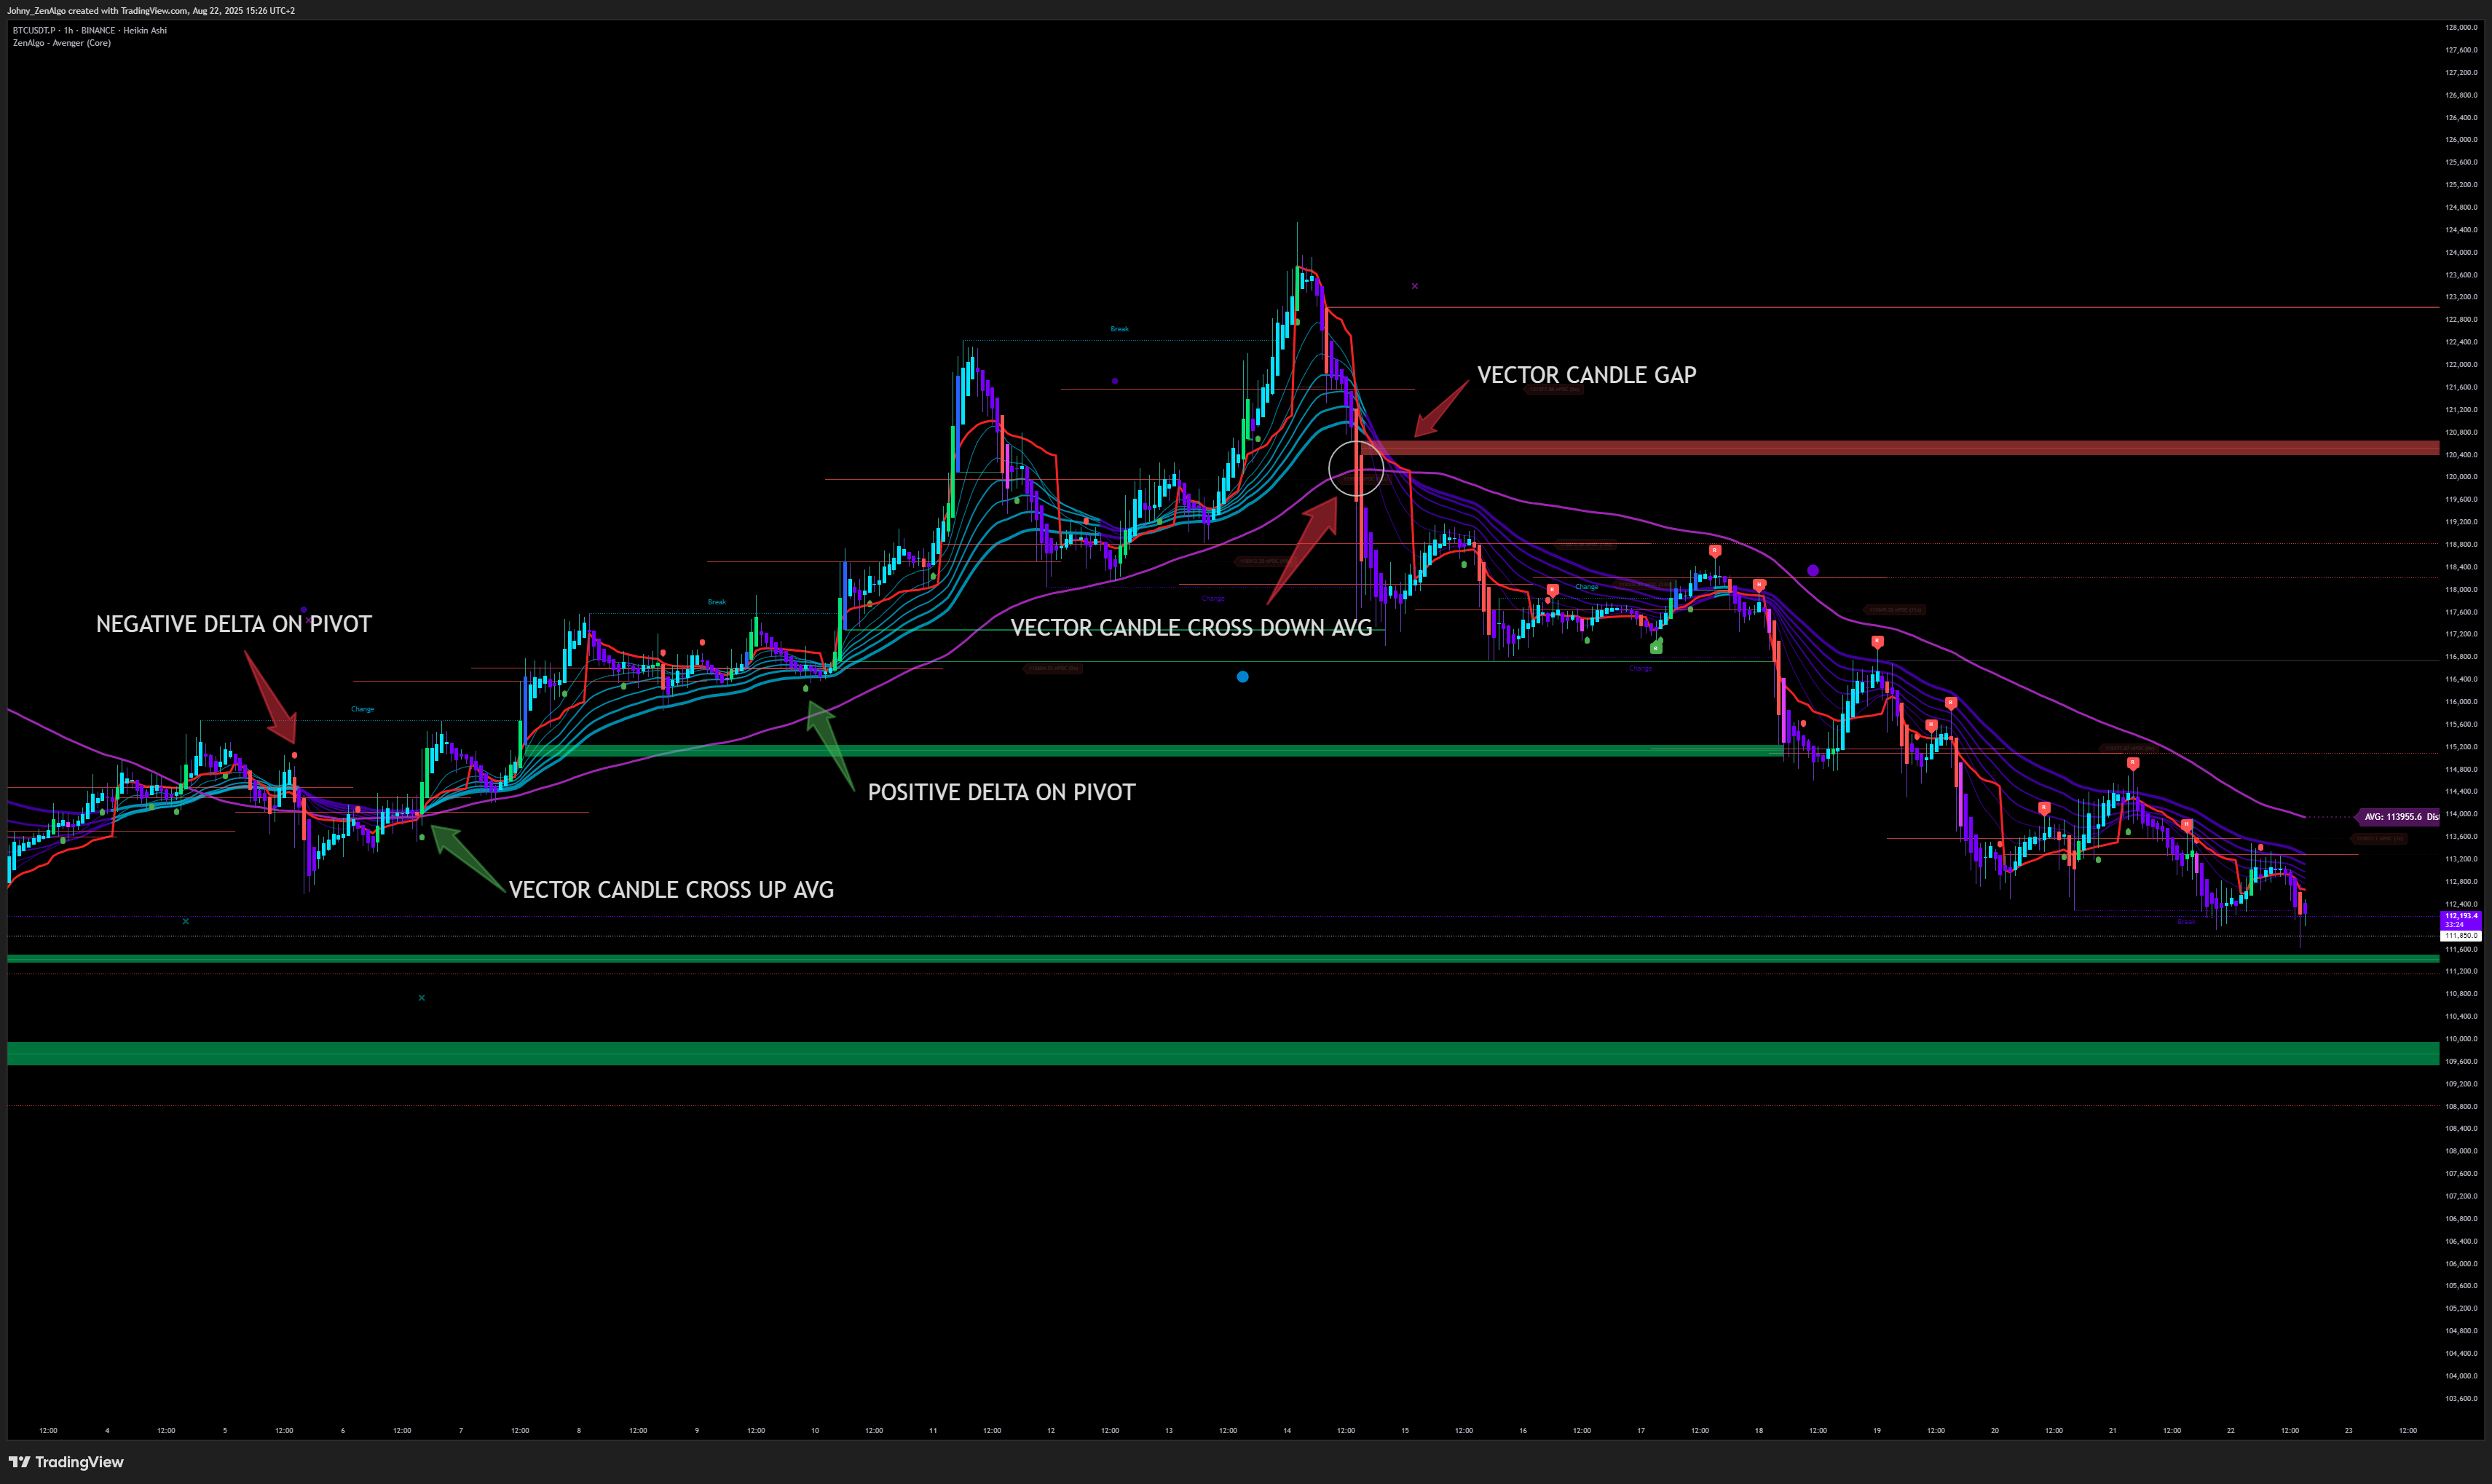
PVSRA Vector Candles
You will also notice vector candles on the chart. These are candles that appear when volume is multiples higher than the surrounding candles.
- Such candles are often highlighted in color
- They typically break through important levels (support, resistance, or ZenAlgo indicator levels)
- When this happens, we say that the chart has “passed the level with a vector”
Empirically, vector candles often mark shifts in momentum or confirm that a trend continuation is valid.
They provide a valuable confluence signal when you are watching for a specific setup to play out.
Following chart clearly illustrate this concept with ZenAlgo - Avenger indicator.
Avoid Trading During Major News
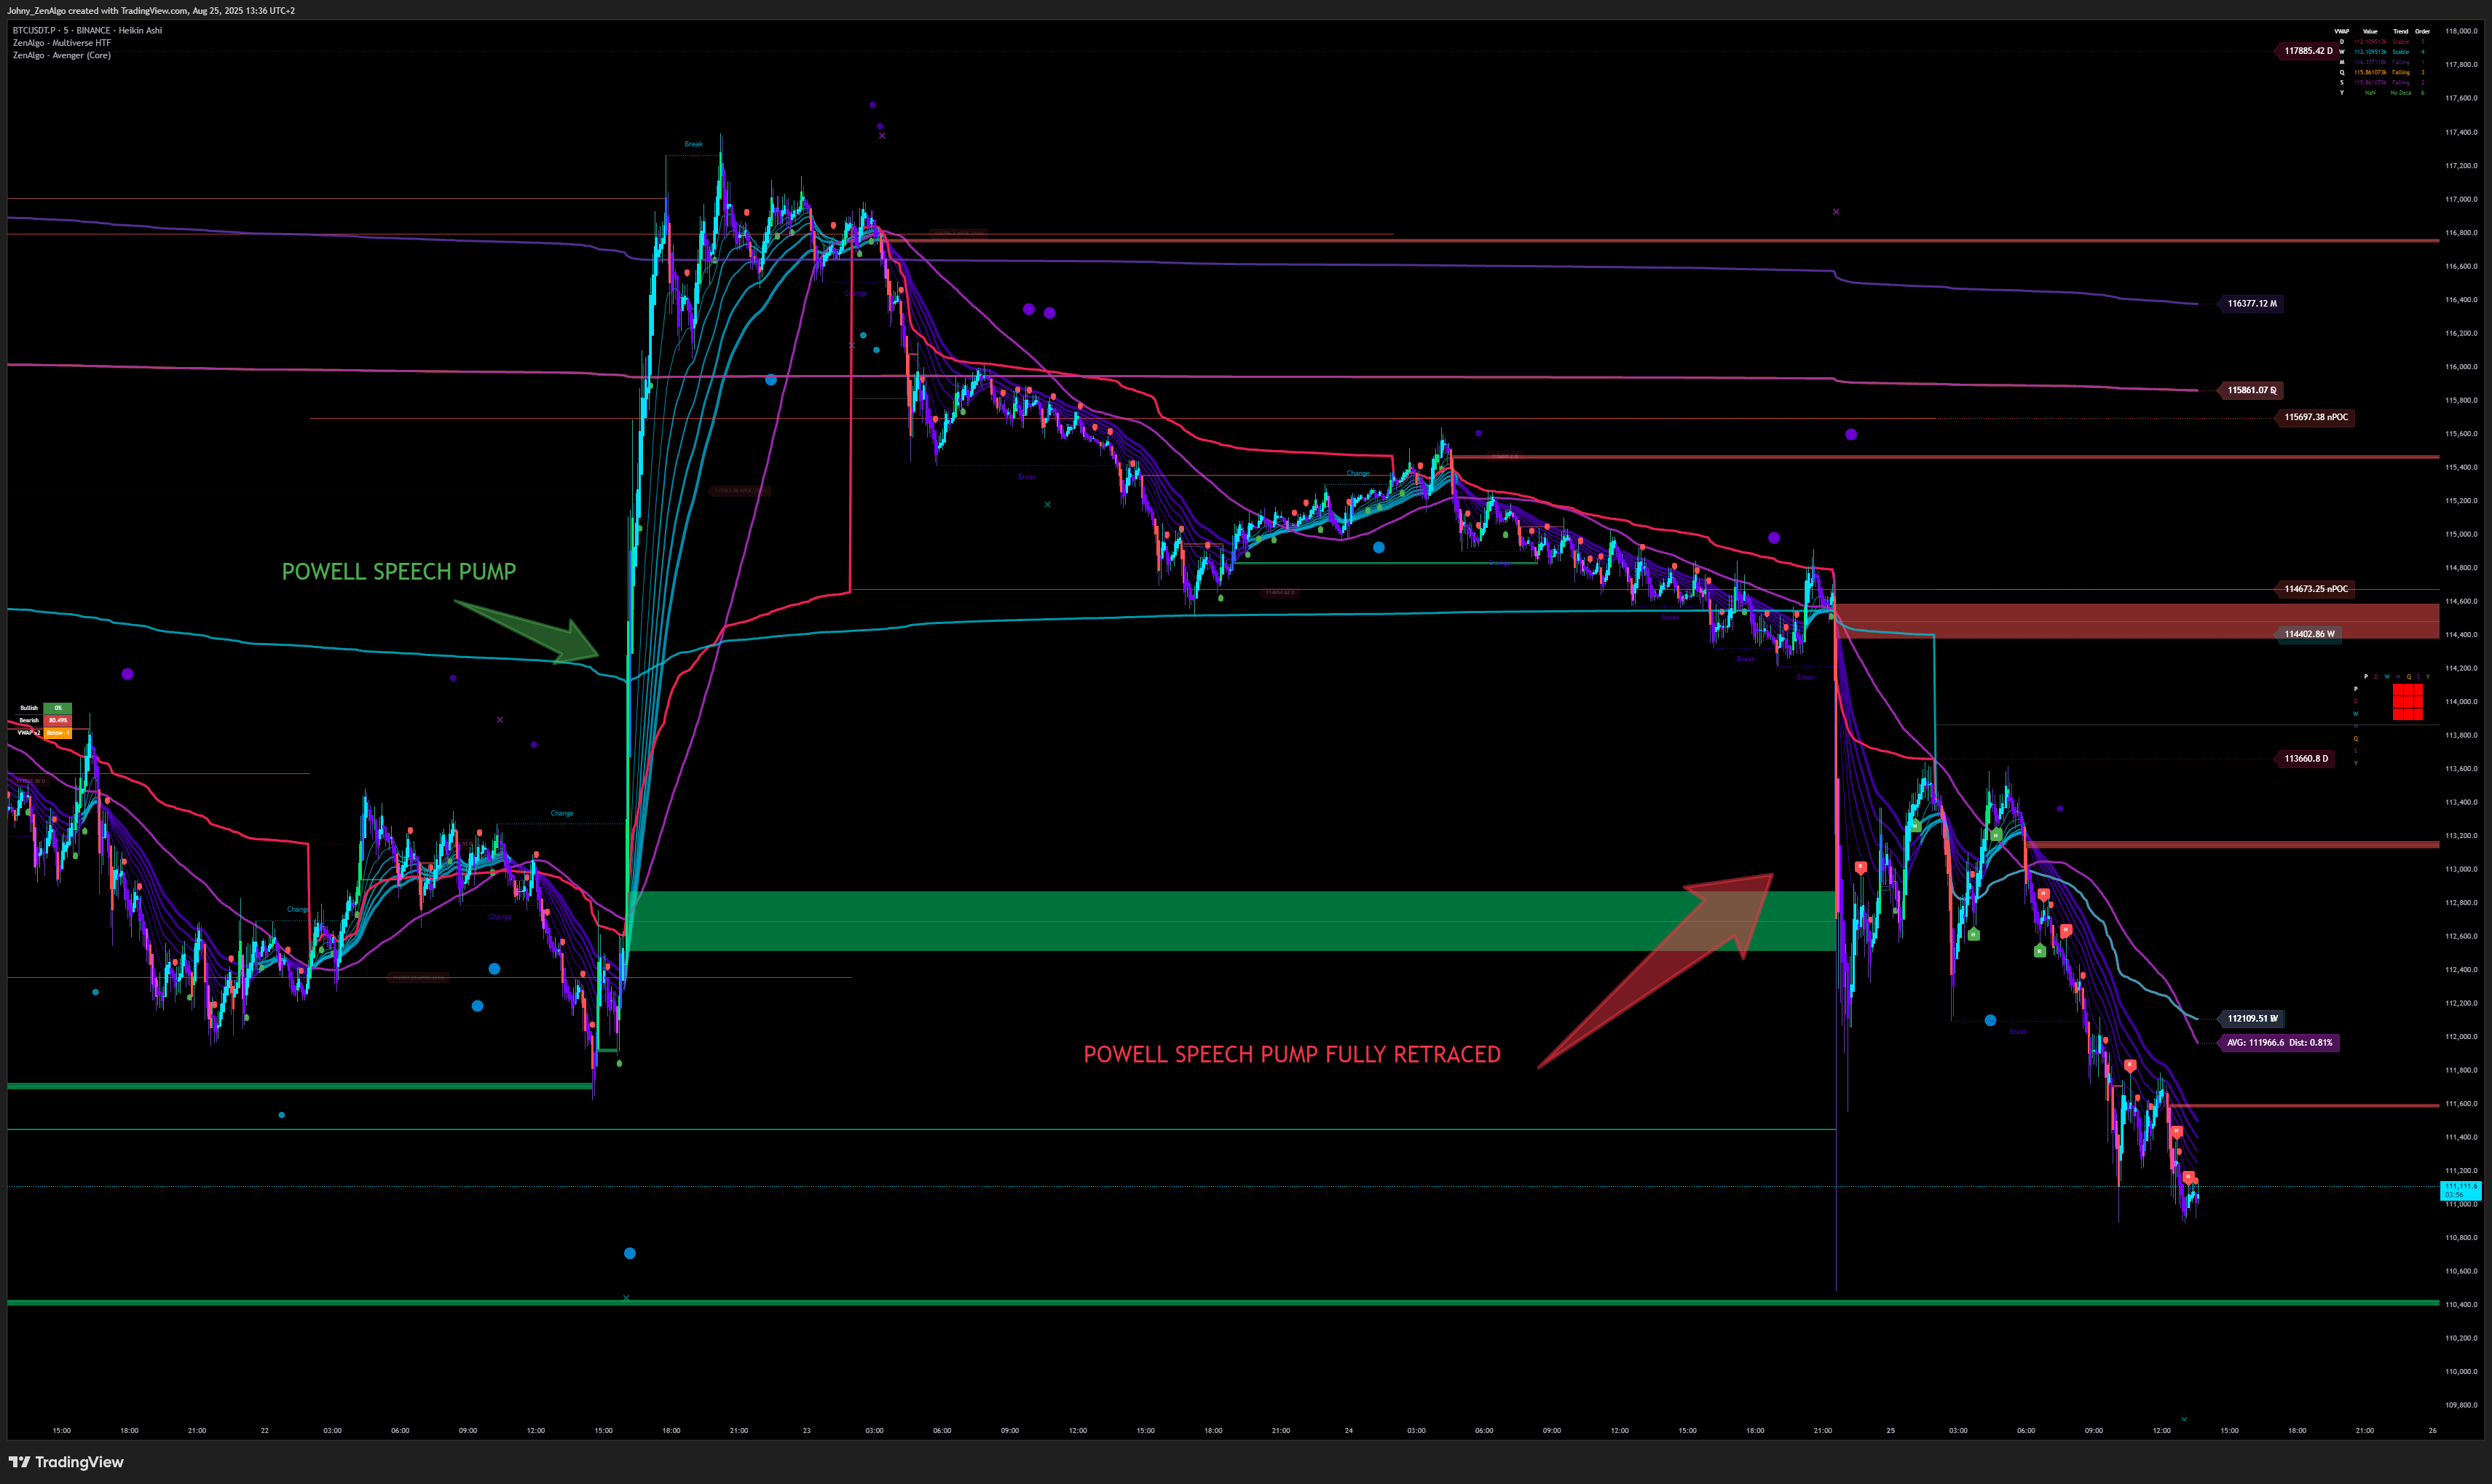
One of the most overlooked rules: do not trade during major news releases.
Why? Because news events often cause unpredictable spikes:
- Traders are psychologically biased toward long positions (most people prefer betting on growth)
- Market makers know this and will frequently push the market down during news, often with a fake breakout to trap both longs and shorts
- The result? Nobody wins—except the market maker
How to Stay Informed
You don't need to guess when news is coming—there are reliable tools to keep you updated:
- TradingView Economic Calendar - available directly inside TradingView
- Forex Factory Calendar - a popular source for major economic events
- Investing.com Economic Calendar - another widely used alternative
In our Discord community, members also frequently share upcoming news events and discuss their potential impact, so you'll rarely miss an important release if you stay active there.
When news is coming, step away. Use that time to study charts, review streams, or simply take a break.
Don't Long at All-Time Highs (ATH)
When the market hits an All-Time High, the temptation is strong to chase the breakout.
This usually ends badly. After ATH, markets tend to retest lower levels.
A simple trick:
- In TradingView, press Alt + I to invert the chart.
- Ask yourself: Would I long this inverted chart right now?
- Most traders would say yes—because it looks like the bottom is in.
- And that's exactly the problem: if it looks like a bottom on the inverted chart, it means it's actually an ATH on the real chart.
Chasing it as a long entry is usually a trap.
This does not automatically mean you should short ATHs either. Shorts should only be taken if other confluences (such as divergences) confirm the setup.
Important Context: Trading vs. Investing
This rule applies specifically to short- and mid-term trading.
If you are a long-term investor buying ETFs or stocks for many years (e.g., passive index investing), then buying at ATH is often perfectly fine.
- Historically, stock indices like the S&P 500 have continued to make new highs over time
- For long-term investors with multi-year horizons, buying at ATH has consistently been profitable, as markets tend to grow over decades
- The difference is that traders look for short-term setups with risk/reward optimization, while investors rely on compounding growth
If you are here to learn trading, follow the ATH rule above. If you are investing long-term, don't worry—ATH entries can still work in your favor.
Stick to Your Stop-Loss (SL) and Take-Profit (TP)
One of the most common mistakes traders make is moving their stop-loss or target mid-trade.
- Price gets close to your SL → you move it lower, hoping for a reversal → the trade keeps going against you → suddenly you're sitting on a much bigger loss.
- Price gets close to your TP → you move it higher, hoping for “just a bit more” → the market reverses → your profit evaporates.
In both cases, the result is the same:
- ❌ Poor risk management
- ❌ Emotional decision-making
- ❌ Regret and confusion
Fixed vs. Dynamic Exits
- If you set your SL and TP based on the strategy in advance, leave them there. Do not adjust them just because the market “looks scary” or “looks promising.”
- If you are using a dynamic exit based on an indicator, then stick to what the indicator tells you. Let the system, not your emotions, decide.
When You Can Exit Early
Exiting early is not the same as moving your levels.
There are legitimate reasons to cut a trade short:
- Market conditions have changed (setup invalidated)
- You've been in the trade too long and the coin isn't moving as expected
- Major news events are approaching and you don't want exposure
The rule is simple:
- 👉 You may exit earlier if conditions demand it.
- ❌ You should never push your SL further away or your TP higher just to “hope for more.”
Why This Matters
Your SL and TP should always be based on a clear reason:
- A technical level
- A divergence
- A trend confirmation
If you cannot explain why you set them where you did, then the trade should not have been opened in the first place.
Changing them mid-trade means your reason has changed too—and that usually means you're no longer trading your system, you're trading your emotions.
Define your SL and TP before entering a trade, and then execute with discipline.
You may exit early if the market gives you valid reasons, but never move your SL or TP further away.
If your plan was solid, you don't need to interfere. If your plan wasn't solid, the mistake was opening the trade in the first place.
Best Data Source: Binance Perpetual
If you are not trading crypto (e.g. forex, stocks), you can skip this core principle as it only applies to crypto traders.
For crypto, the cleanest chart data comes from Binance Perpetual (e.g. for BTC ticker BTCUSDT.P).
This pair has consistently shown:
- High liquidity
- Fewer fakeouts and random spikes compared to smaller exchanges
- More reliable price action for backtesting
If you execute trades on another exchange, keep in mind that charts may look slightly different. The principles remain the same, but always align your analysis with a reliable data feed.
The “Domina” Index
Within ZenAlgo, you will sometimes see references to “Domina”.
This is a custom ticker we created by combining:
CRYPTOCAP:BTC.D+CRYPTOCAP:USDT.D+CRYPTOCAP:USDC.D
Put the full text into TW symbol search and hit ENTER:
This index tracks BTC dominance + stablecoin dominance.
We call it Domina because it reflects the flow of money between Bitcoin, stables, and the rest of the crypto market.
- If Domina is in an uptrend (i.e., a chart you would normally long), it usually means capital is flowing into BTC and stables
- That implies money is flowing out of altcoins
- In such cases, we look for short opportunities on alts
This is a key macro filter when aligning trades with broader market flows.
Divergence (The Core of Our Strategy)
If you take away only one thing from this guide, let it be this:
Learning to read and recognize divergence between price and indicators is the absolute foundation of our strategy.
What Is Divergence?
A divergence happens when the price on the chart and a technical indicator move in opposite directions.
It signals a hidden imbalance between what the market shows on the surface (price action) and what is actually happening under the hood (momentum, volume, or strength).
- Bullish Divergence → Price makes a lower low (price goes down), but the indicator makes a higher low (indicator goes up) → selling pressure is weakening, reversal upward is likely.
- Bearish Divergence → Price makes a higher high, but the indicator makes a lower high → buying pressure is weakening, reversal downward is likely.
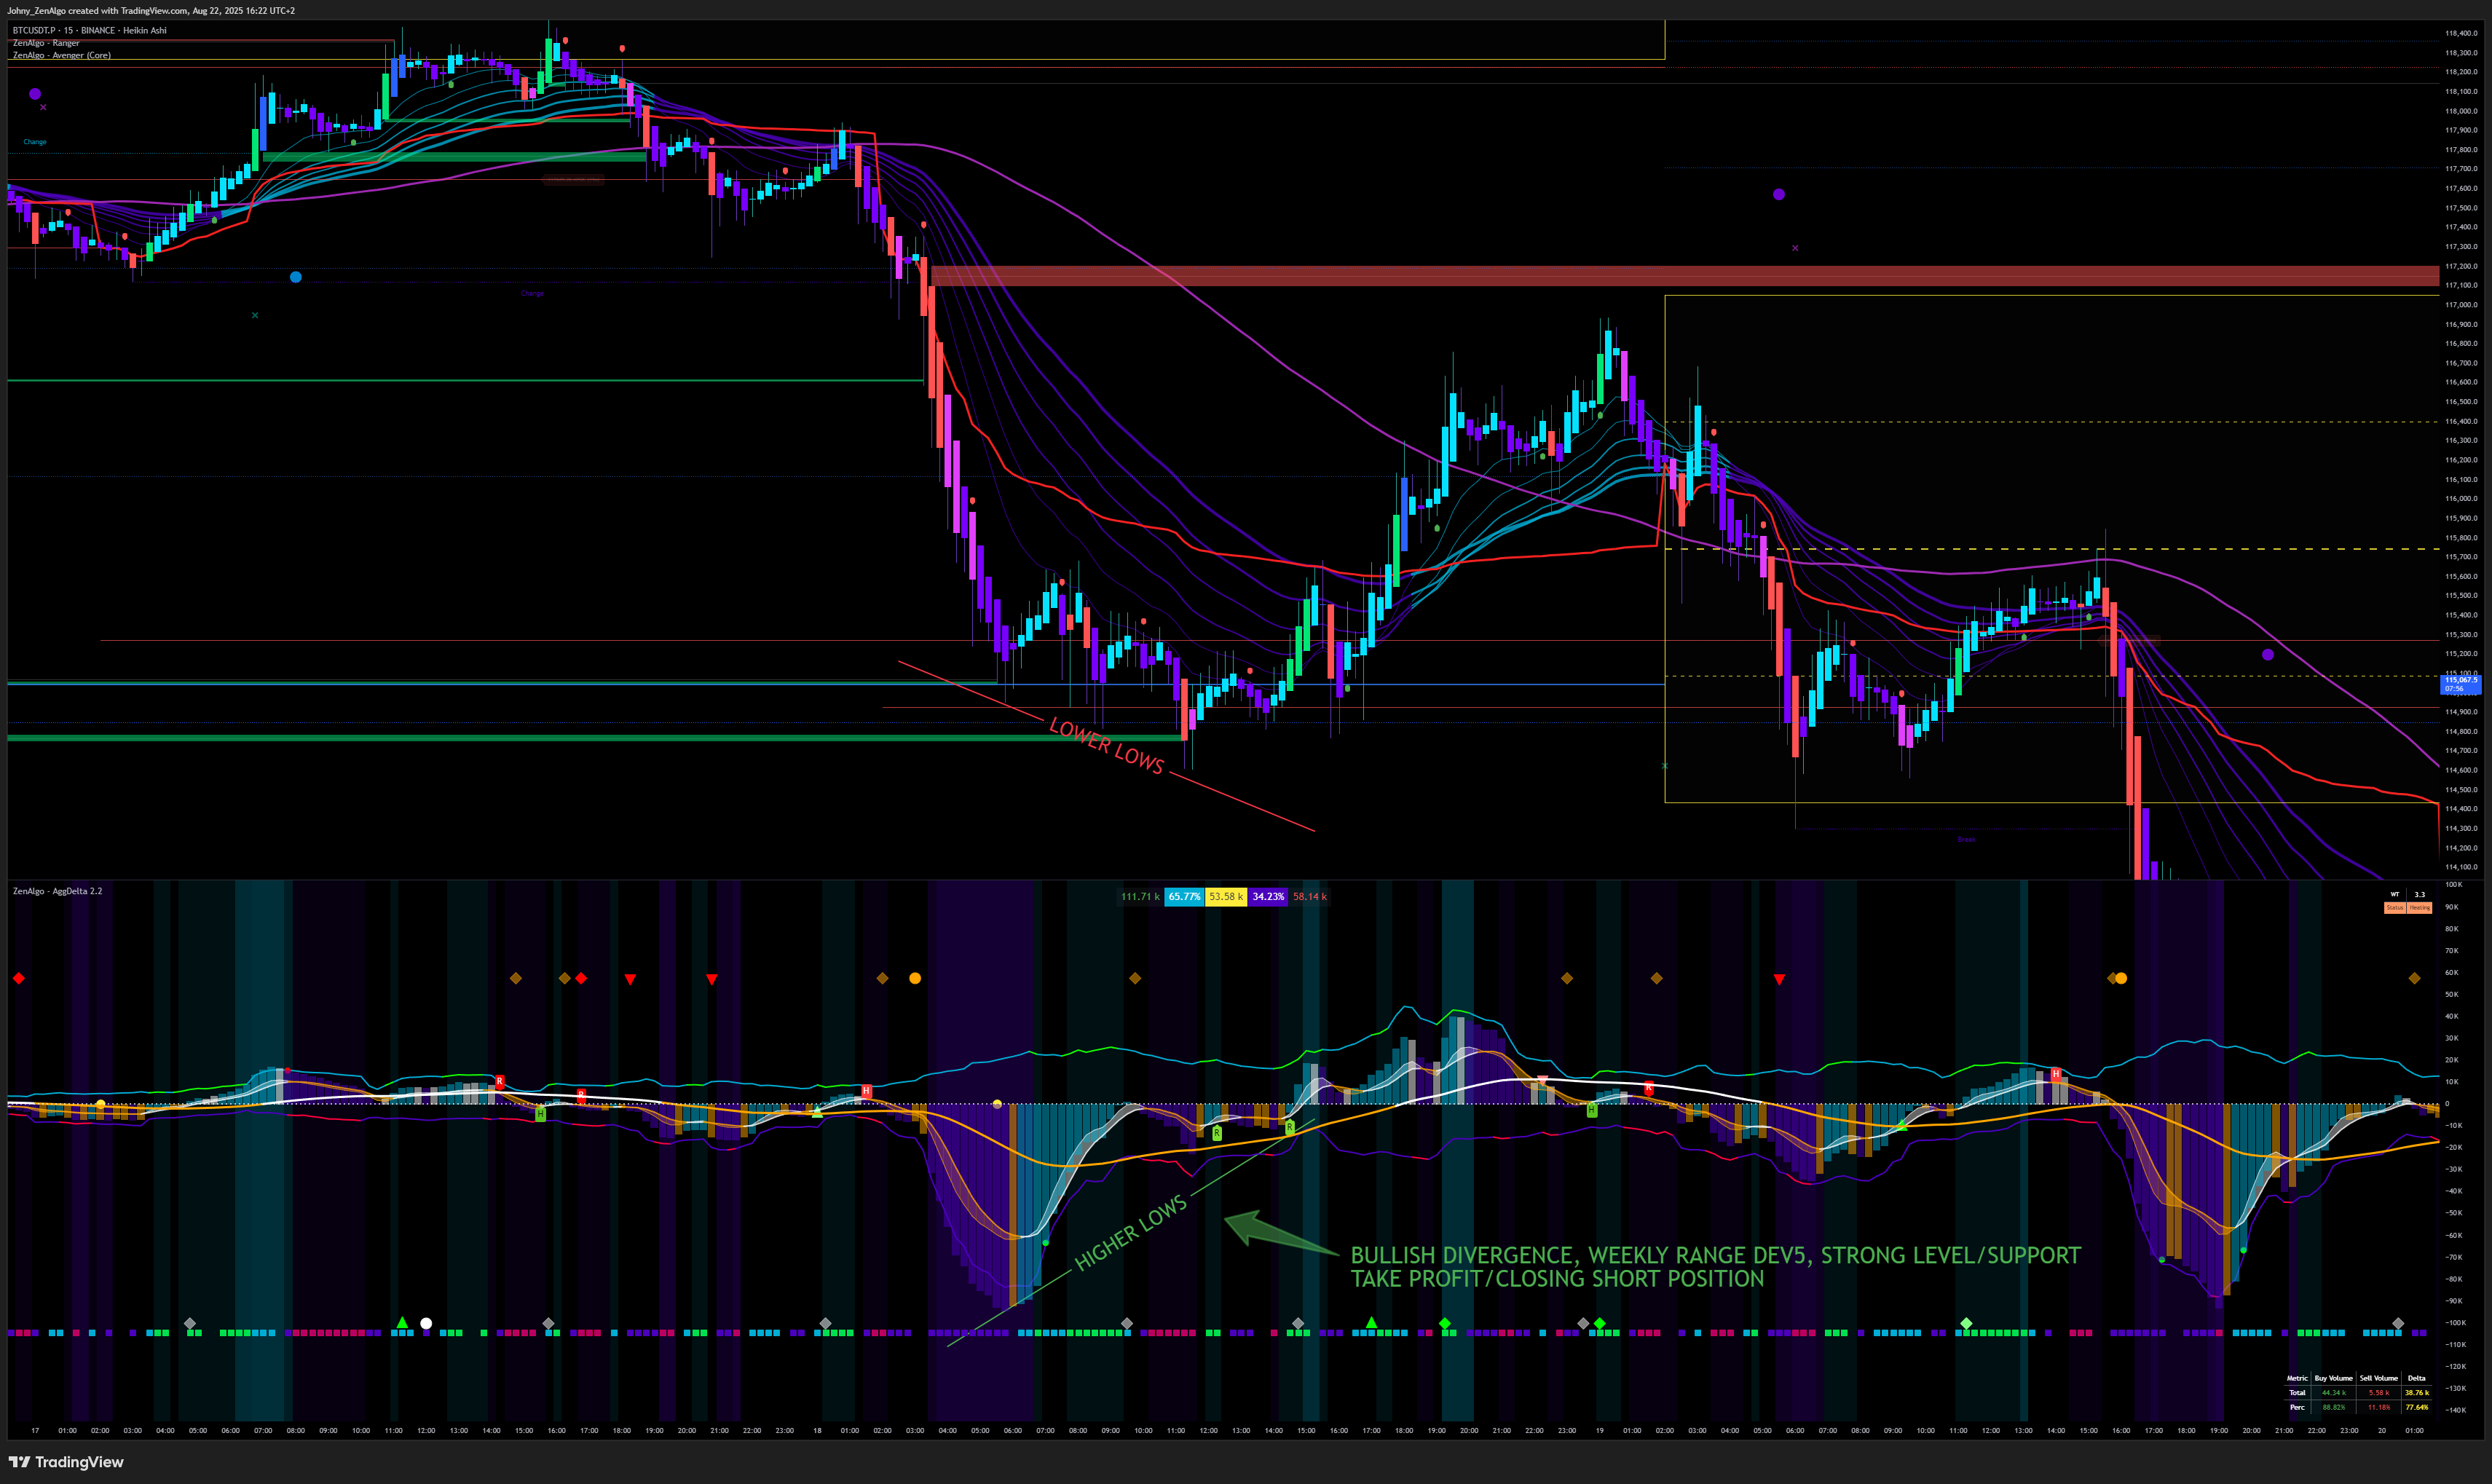
Why Divergence Matters
Divergence is not just another signal—it is the backbone of our trading system.
It gives you critical insight into when a trend is losing strength and helps you anticipate reversals before they are obvious on price action alone. It gives you the edge.
If you master divergence:
- You will know when not to enter (avoiding false breakouts and FOMO entries)
- You will identify high-probability entry points
- You will develop the confidence to stay patient, waiting for the market to reveal weakness or strength
This is why we say: no divergence, no trade.
Indicators and Divergence
The beauty of divergence is that it can be applied to almost any indicator:
- Momentum-based (e.g., RSI, MACD)
- Volume-based (e.g., Delta)
- Custom ZenAlgo indicators
The principle is always the same:
If the price tells one story and the indicator tells another, the divergence is the clue.
Example Scenarios
-
Bullish Divergence at Support
- Price pushes below support and prints a new low
- Your indicator refuses to follow (higher low)
- Instead of breaking down, the market bounces → prime long entry
-
Bearish Divergence at Resistance
- Price spikes into resistance with a new high
- Your indicator prints a weaker high
- The move fails → prime short entry
-
Hidden Divergence (Continuation)
- Sometimes divergence signals not a reversal, but a continuation of the trend
- Example: Price makes a higher low, but the indicator makes a lower low → suggests strength still lies with the prevailing trend
The Size of Divergence Matters
Not all divergences are equal.
- A “divergence” that forms across just 3-5 candles is often noise → low significance.
- A divergence that spans a clear swing high/low across many candles carries real weight.
- Always look for obvious, visually clear divergences—the ones you can spot at first glance.
If you have to squint or force it, it's probably not worth trading.
How to Train Your Eye
Reading divergence is a skill, and like any skill, it can be learned, but it requires practice:
- Scroll back in history and mark divergences between price and indicators
- Notice how often they precede major reversals or continuations
- Don't just memorize patterns—understand the logic: if price says “strong,” but the indicator says “weak,” who do you trust?
With enough chart time, spotting divergence becomes second nature.
Final Word on Divergence
We cannot overstate this: divergence is the cornerstone of ZenAlgo trading.
Without it, you are guessing. With it, you have context, timing, and edge.
When we later describe exact setups in this strategy, divergence will always be the confirmation we look for.
It is the difference between chasing noise and trading with precision.
Summary of Core Principles
- ✅ Always use Heikin Ashi candles for cleaner signals
- ✅ Watch for vector candles as trend confirmation
- ❌ Avoid trading during news events
- ❌ Don't chase ATH breakouts—check psychology with chart inversion
- ✅ Set your stop-loss and take-profit before entering—then stick to them
- ✅ Base your analysis on Binance Perpetual (BTCUSDT.P) data, if trading crypto
- ✅ Use the Domina index to gauge market-wide money flow
- ✅ Look for divergence between price and indicators for high-quality setups
Choose Your Trading Path
Not every trader is the same.
Your strategy depends on how you prefer to trade, which timeframes you focus on, and how much time you can realistically spend at the charts.
You don't have to lock yourself into just one category—many traders use different approaches at different times.
But for any given trade, you should always follow the rules of the path you're in.
Trader Self-Assessment
Answer these questions to see which category you fit into.
| Question | 🟢 Hodler | 🔵 HTF Swing Trader | 🔴 LTF Day Trader / Scalper |
|---|---|---|---|
| How much time can I dedicate each day? | A few minutes per week | A few hours every few days | Several hours per day, watching charts closely |
| How patient am I with holding trades? | Weeks to months | Several days to a week | Minutes to hours |
| Do I enjoy fast-paced or slower setups? | Slow and steady | Balanced pace | Fast-paced, high adrenaline |
| Which timeframes feel most natural? | Daily and above | 1H - 4H | 3M, 5M (with 15M as confirmation) |
Each category has its own rules, setups, and best practices.
Once you've identified where you fit, follow the step-by-step guide for that style:
- Hodler Strategy (Coming Soon)
- HTF Swing Strategy (Coming Soon)
- LTF Day Trading / Scalping Strategy
LTF Day Trading / Scalping Strategy
The example images shown in this guide may come from different timeframes than the one being discussed for this strategy.
Always follow the timeframe stated in the text of the strategy, not what you see in the screenshot.
Images are included only to illustrate concepts and demonstrate how indicators look visually on the chart in different situations.
They are not a signal to copy directly or a substitute for the written rules of the strategy.
Timeframes We Use
This strategy is built for Lower Timeframes (LTF):
- Entries: 3-minute (3m) and 5-minute (5m) charts
- Confirmation: 15-minute (15m) chart
- Context / Zoom-Out: 1-hour (1h) chart
The 5m chart is your primary working chart.
The 3m chart gives sharper entries, the 15m chart helps confirm signals, and the 1h chart provides the bigger picture.
Tools We Use
For this workflow, you will need the following ZenAlgo indicators and the Domina index as explained above.
Each one plays a specific role in identifying, confirming, or executing trades.
-
Domina → A custom BTC + stablecoin dominance index.
It tracks capital rotation between Bitcoin, stables, and the rest of the crypto market.
When Domina trends up, it signals capital leaving alts (bearish for altcoins). -
Avenger → A multi-layered volume and trend analysis tool.
It combines Delta bands, EMA ribbons, average price anchors, POC levels, and divergence markers to show key zones of momentum shifts, fair value, and potential reversals. -
Ranger → A precise VWAP-based range tool with minute-level accuracy.
It defines daily ±2σ zones for mean reversion, draws Monday's VWAP range across the whole week, and offers additional deviation bands and optional buy/sell delta overlays. -
Delta → The core volume flow indicator.
It separates buy vs. sell volume and is our primary tool for spotting divergences between price and volume activity. Divergence detection is manual, but absolutely central to this strategy. -
Bender → A deep multi-exchange volume flow visualizer.
It aggregates buy/sell flows and Delta from multiple venues, colors activity bars, and flags anomalies. Great for spotting sudden shifts in participation or hidden liquidity moves. -
Multiverse → A multi-timeframe VWAP mapping system.
It plots VWAPs from daily, weekly, monthly, quarterly, semi-annual, and yearly anchors, each with value bands. These serve as critical confluence levels where price often reacts or mean-reverts.
Each of these tools has a specific role, and we will explain how they fit together as we go step by step.
If you don't have ZenAlgo indicators yet, you can get them here.
Why We Start With Shorts
This guide focuses on short setups only.
There are two reasons for this:
-
Psychological Challenge
Most traders naturally prefer to long, because human psychology is biased toward growth.
Shorting feels counterintuitive and emotionally harder. By learning short setups first, you train discipline and avoid the “default long bias.” -
Logical Symmetry
Once you master shorts, longs are simply the mirror image of the same rules.
Every concept described here can be inverted into a long strategy later.
Once you are comfortable and consistent, flipping the logic for longs will feel natural and easy.
Pillars of the Strategy: WHERE & WHEN
Every trade requires two answers: WHERE and WHEN.
Without both, you're guessing.
-
WHERE = Context & Direction
- Where price is now within a range or structure.
- Where it's likely headed (dominant trend).
-
WHEN = Timing the entry
You wait for price to reach your area of interest and for confirmation (e.g., divergence) to appear on your execution timeframe.
A Map Analogy (Why Context Comes First)
If you're walking in the middle of nowhere and don't know where the next town is, you're lost—you might make random choices and waste hours.
That's a trader entering mid-range without realizing it: waiting for a reaction that might be hundreds of “kilometers” (candles) away.
If you're inside a city but searching for a street that isn't in that city, you'll never find it—because your map is zoomed in too far.
That's a trader stuck on LTF (3m/5m) who forgot to zoom out: the setup doesn't exist on this chart because the higher timeframe trend contradicts it.
Always identify WHERE you are in the higher-timeframe structure before you try to trade the LTF.
Our HTF → LTF Framework (Short-Only in this guide)
-
Zoom-out first (1h):
Confirm we're in a downtrend (e.g., lower highs/lows, HA structure, trend ribbon pressure).
Check that no strong bullish divergence is forming that could soon reverse the 1h trend.Trend is your friend—until the end (of that trend). We don't guess the end; we follow it.
-
Then drop to 15m & 5m:
Look for pullbacks against the 1h downtrend into meaningful levels.
We hunt for bearish continuation confirmation (e.g., bearish divergence) to time entries with the higher-timeframe trend.
What We Do Not Do: Catch Reversals
Catching exact tops feels satisfying—but it's riskier and harder than trading with the trend.
This strategy does not trade reversals. We align with the 1h direction and use LTF only for precision timing.
Practical Rules (General, not the full checklist yet)
- Always start on 1h (context), confirm downtrend for shorts.
- Only then move to 15m for confirmation and 5m (3m) for execution.
- Don't take mid-range random trades. Identify whether you're near range high/low or a key value area first.
- Wait for confirmation. If you think a divergence might form, don't front-run—wait until it actually prints.
- Set alerts at your areas (levels, trendlines, VWAPs, indicator signals) so the chart calls you when it's time.
We'll break this into exact steps (what to check on 1h, what to mark, what to wait for on 15m/5m) in the next sections.
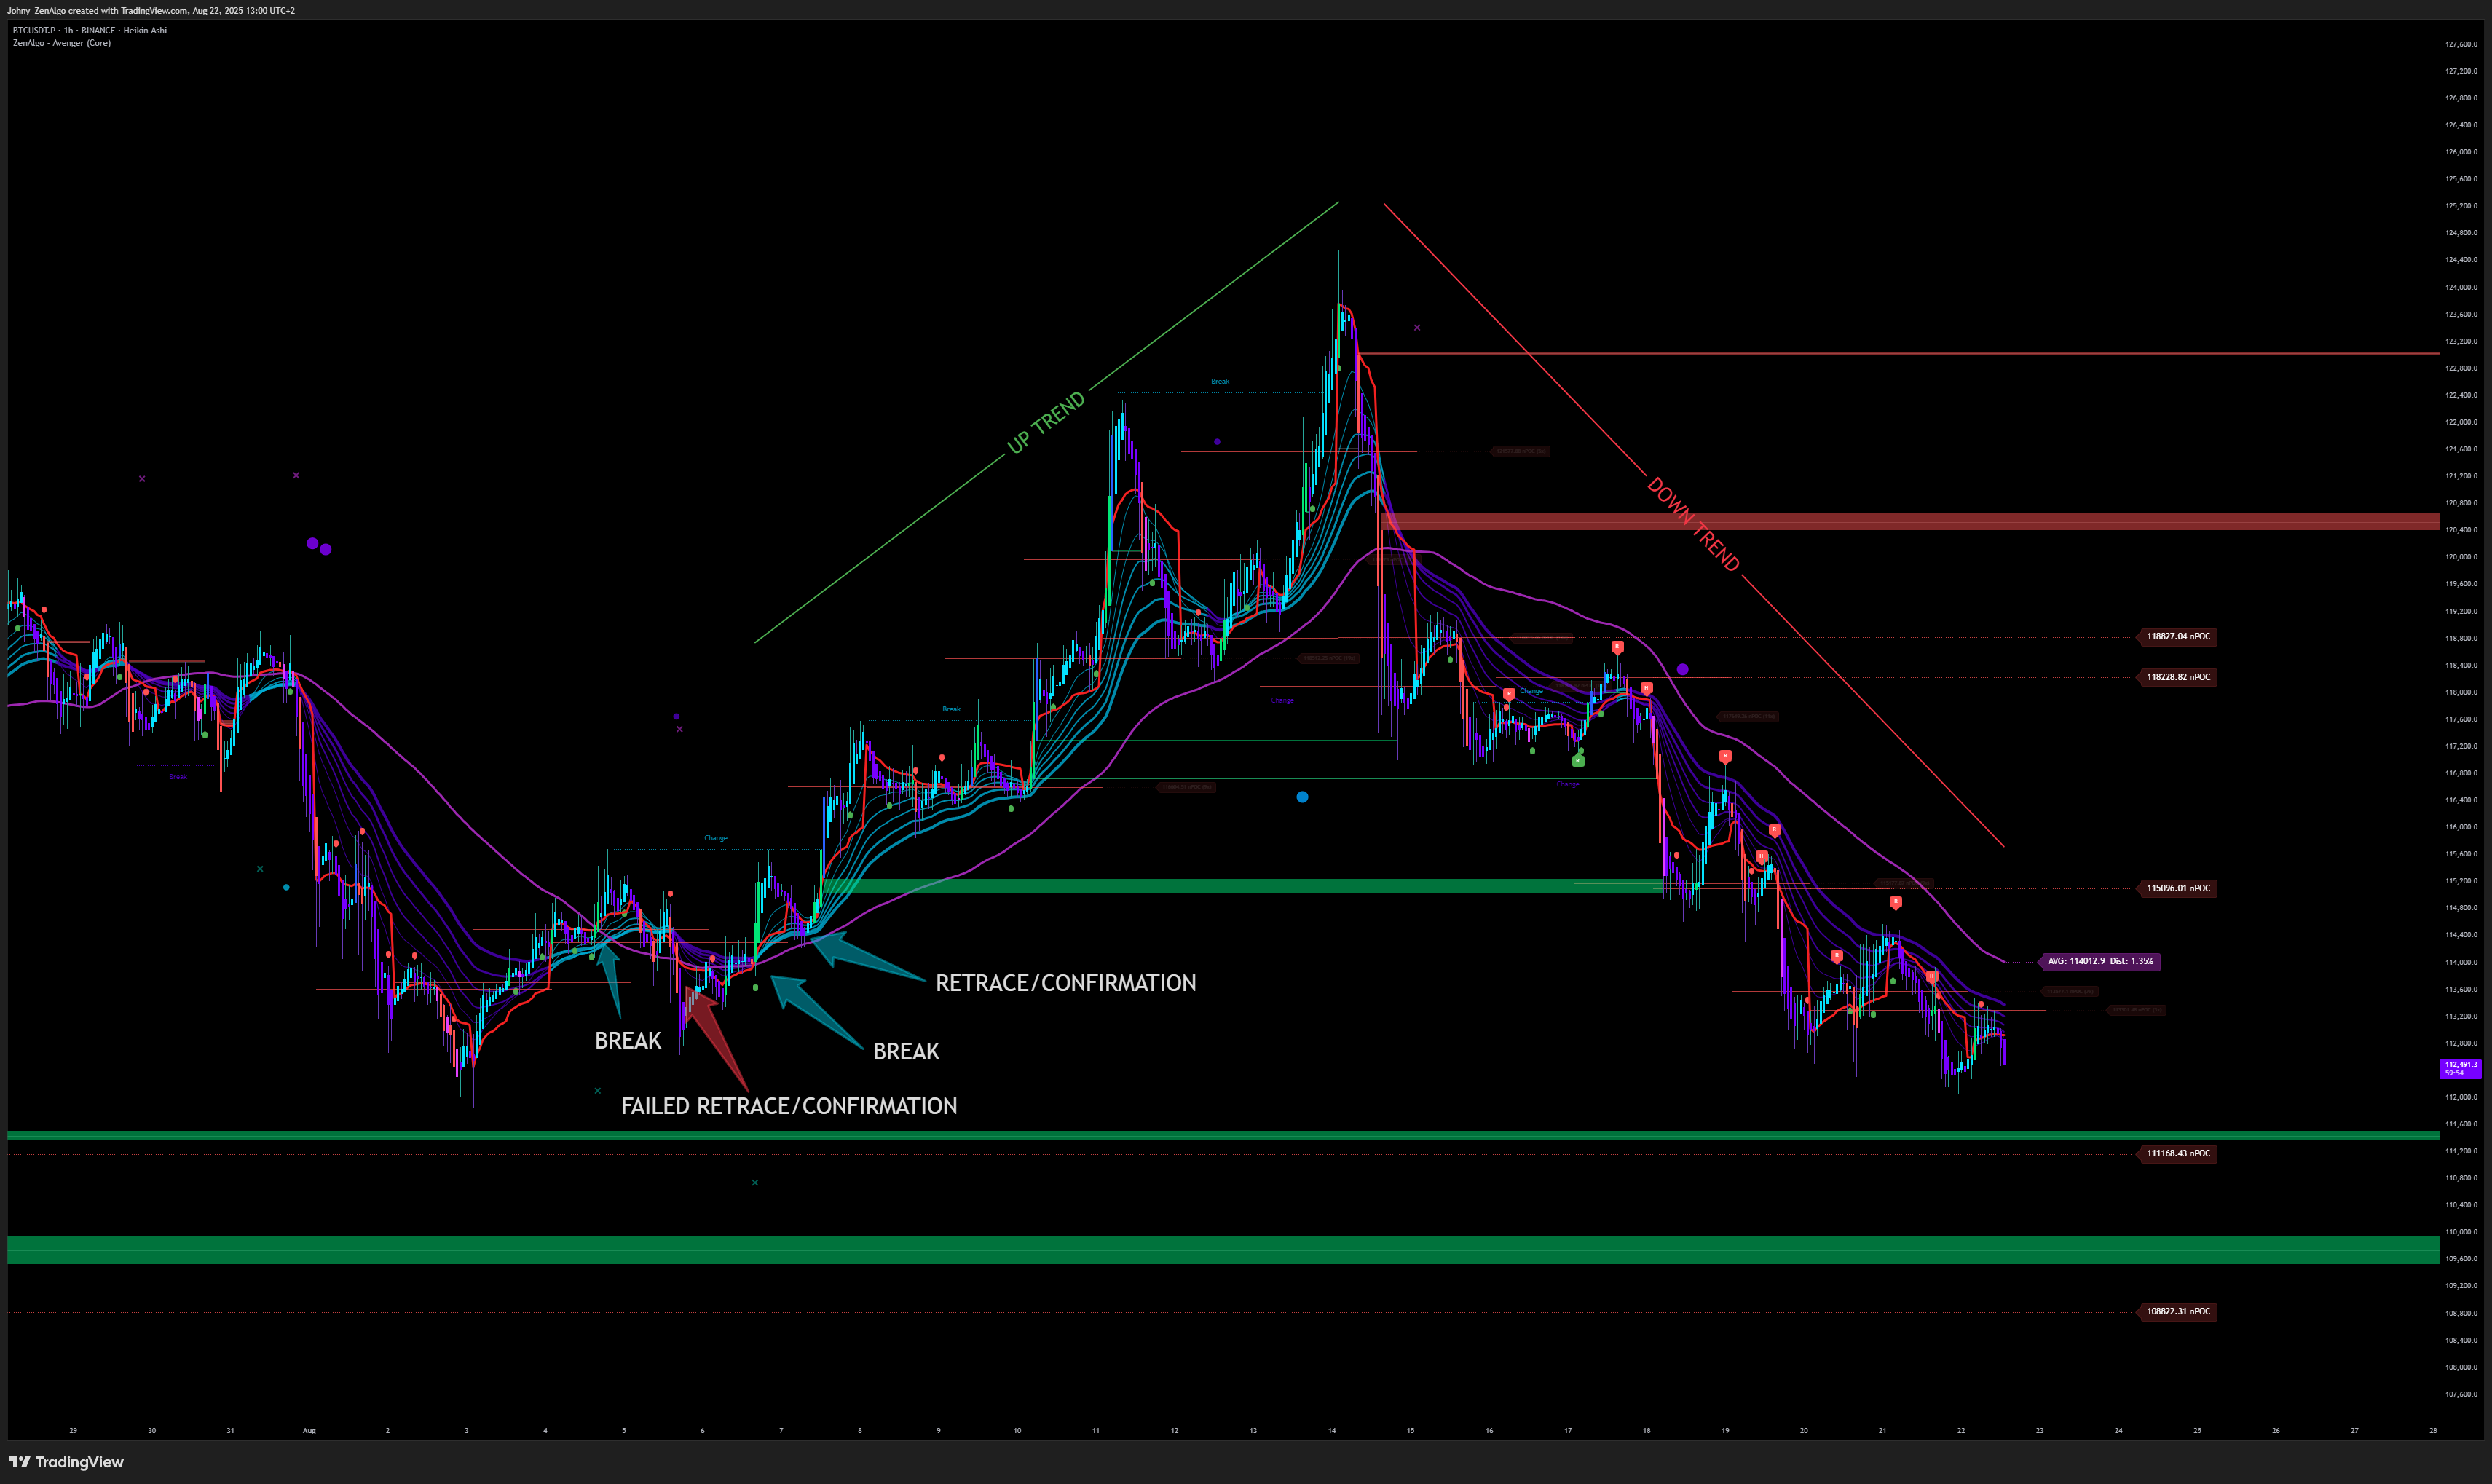
Learn to Identify the Trend with Avenger
The very first step in our strategy is to correctly identify the trend.
For this, we use the Avenger indicator.
What to Look At
Avenger plots multiple bands (lines) directly from price action.
At this stage we ignore Delta and volume—this is pure structure.
- Turquoise bands = Price is trading above them → we are in an uptrend
- Purple bands = Price is trading below them → we are in a downtrend
Among these bands, one line is especially important:
- AVG Line → A dynamic average anchor that combines the bands intelligently
- When price breaks through AVG, it often signals a trend change
- You can also see, that usually the break through AVG line is done with a vector candle.
Breaks, Fakeouts, and Confirmations
After price crosses the AVG, three scenarios can occur:
-
Break → Confirmation
Price breaks the AVG, pulls back, and then rejects from the AVG in the new direction.
This confirms the trend change. ✅ -
Break → Fakeout
Price breaks the AVG but then quickly returns to the previous side.
The breakout fails, and the old trend resumes. ❌ -
Neutral Zone
After crossing the AVG, price may hover without clear rejection or continuation.
This is an indecision phase—usually not tradable. ⏸️
Why This Matters
Before anything else, you must know if the market is in an uptrend, downtrend, or indecision.
Trading without this context is like walking in the middle of nowhere without a map—you don't know if the next “city” (target) is the city you are aming for.
Strategy Step 1: Confirm the Higher-Timeframe Trend
Before moving to lower timeframes, we must confirm that the overall market context supports short setups.
This step ensures we're not trading against the flow of capital or against the dominant trend.
1. Check the Domina Index
- Open the Domina index (
CRYPTOCAP:BTC.D+CRYPTOCAP:USDT.D+CRYPTOCAP:USDC.D) on 1h. - Confirm that Domina is in a clear uptrend.
- This means capital is flowing into Bitcoin and stables.
- When this happens, money is leaving altcoins → bearish context for alts.
✅ Only continue if Domina is uptrending.
If Domina is sideways or unclear, step aside.
2. Zoom Out on the 1h Chart
- On your trading chart (the asset you plan to trade), zoom out to the 1-hour timeframe.
- Using Avenger, confirm that the chart is in a clear downtrend:
- Price trading below the purple bands
- AVG line broken to the downside and confirmed (not just a fakeout)
- No strong bullish divergence forming that would signal an upcoming reversal
✅ Only continue if your chart is in a confirmed downtrend.
Summary for Step 1
- Domina → must be uptrending (capital flowing out of alts)
- Your chart (1h) → must be in downtrend (confirmed with Avenger)
If both conditions are met, you have alignment between macro flow and chart structure—the foundation for all following steps.
Understanding Ranges with Ranger
Before moving to Step 2 of the strategy, we must understand where the interesting levels are—the places where price tends to react.
Without this map, you're walking blind.
Ranges as Your Map
Think of the chart as a landscape:
- Ranges are like towns and cities. Price often reacts strongly at their borders.
- If you are mid-range, you're “in the middle of nowhere.” Price is less likely to turn here—it's more likely to continue.
- If you are at the range edge, that's where meaningful reactions happen—like arriving at a city gate.
This is why Ranger is our map and compass:
- It shows where the towns (ranges) are
- It shows your current position relative to them
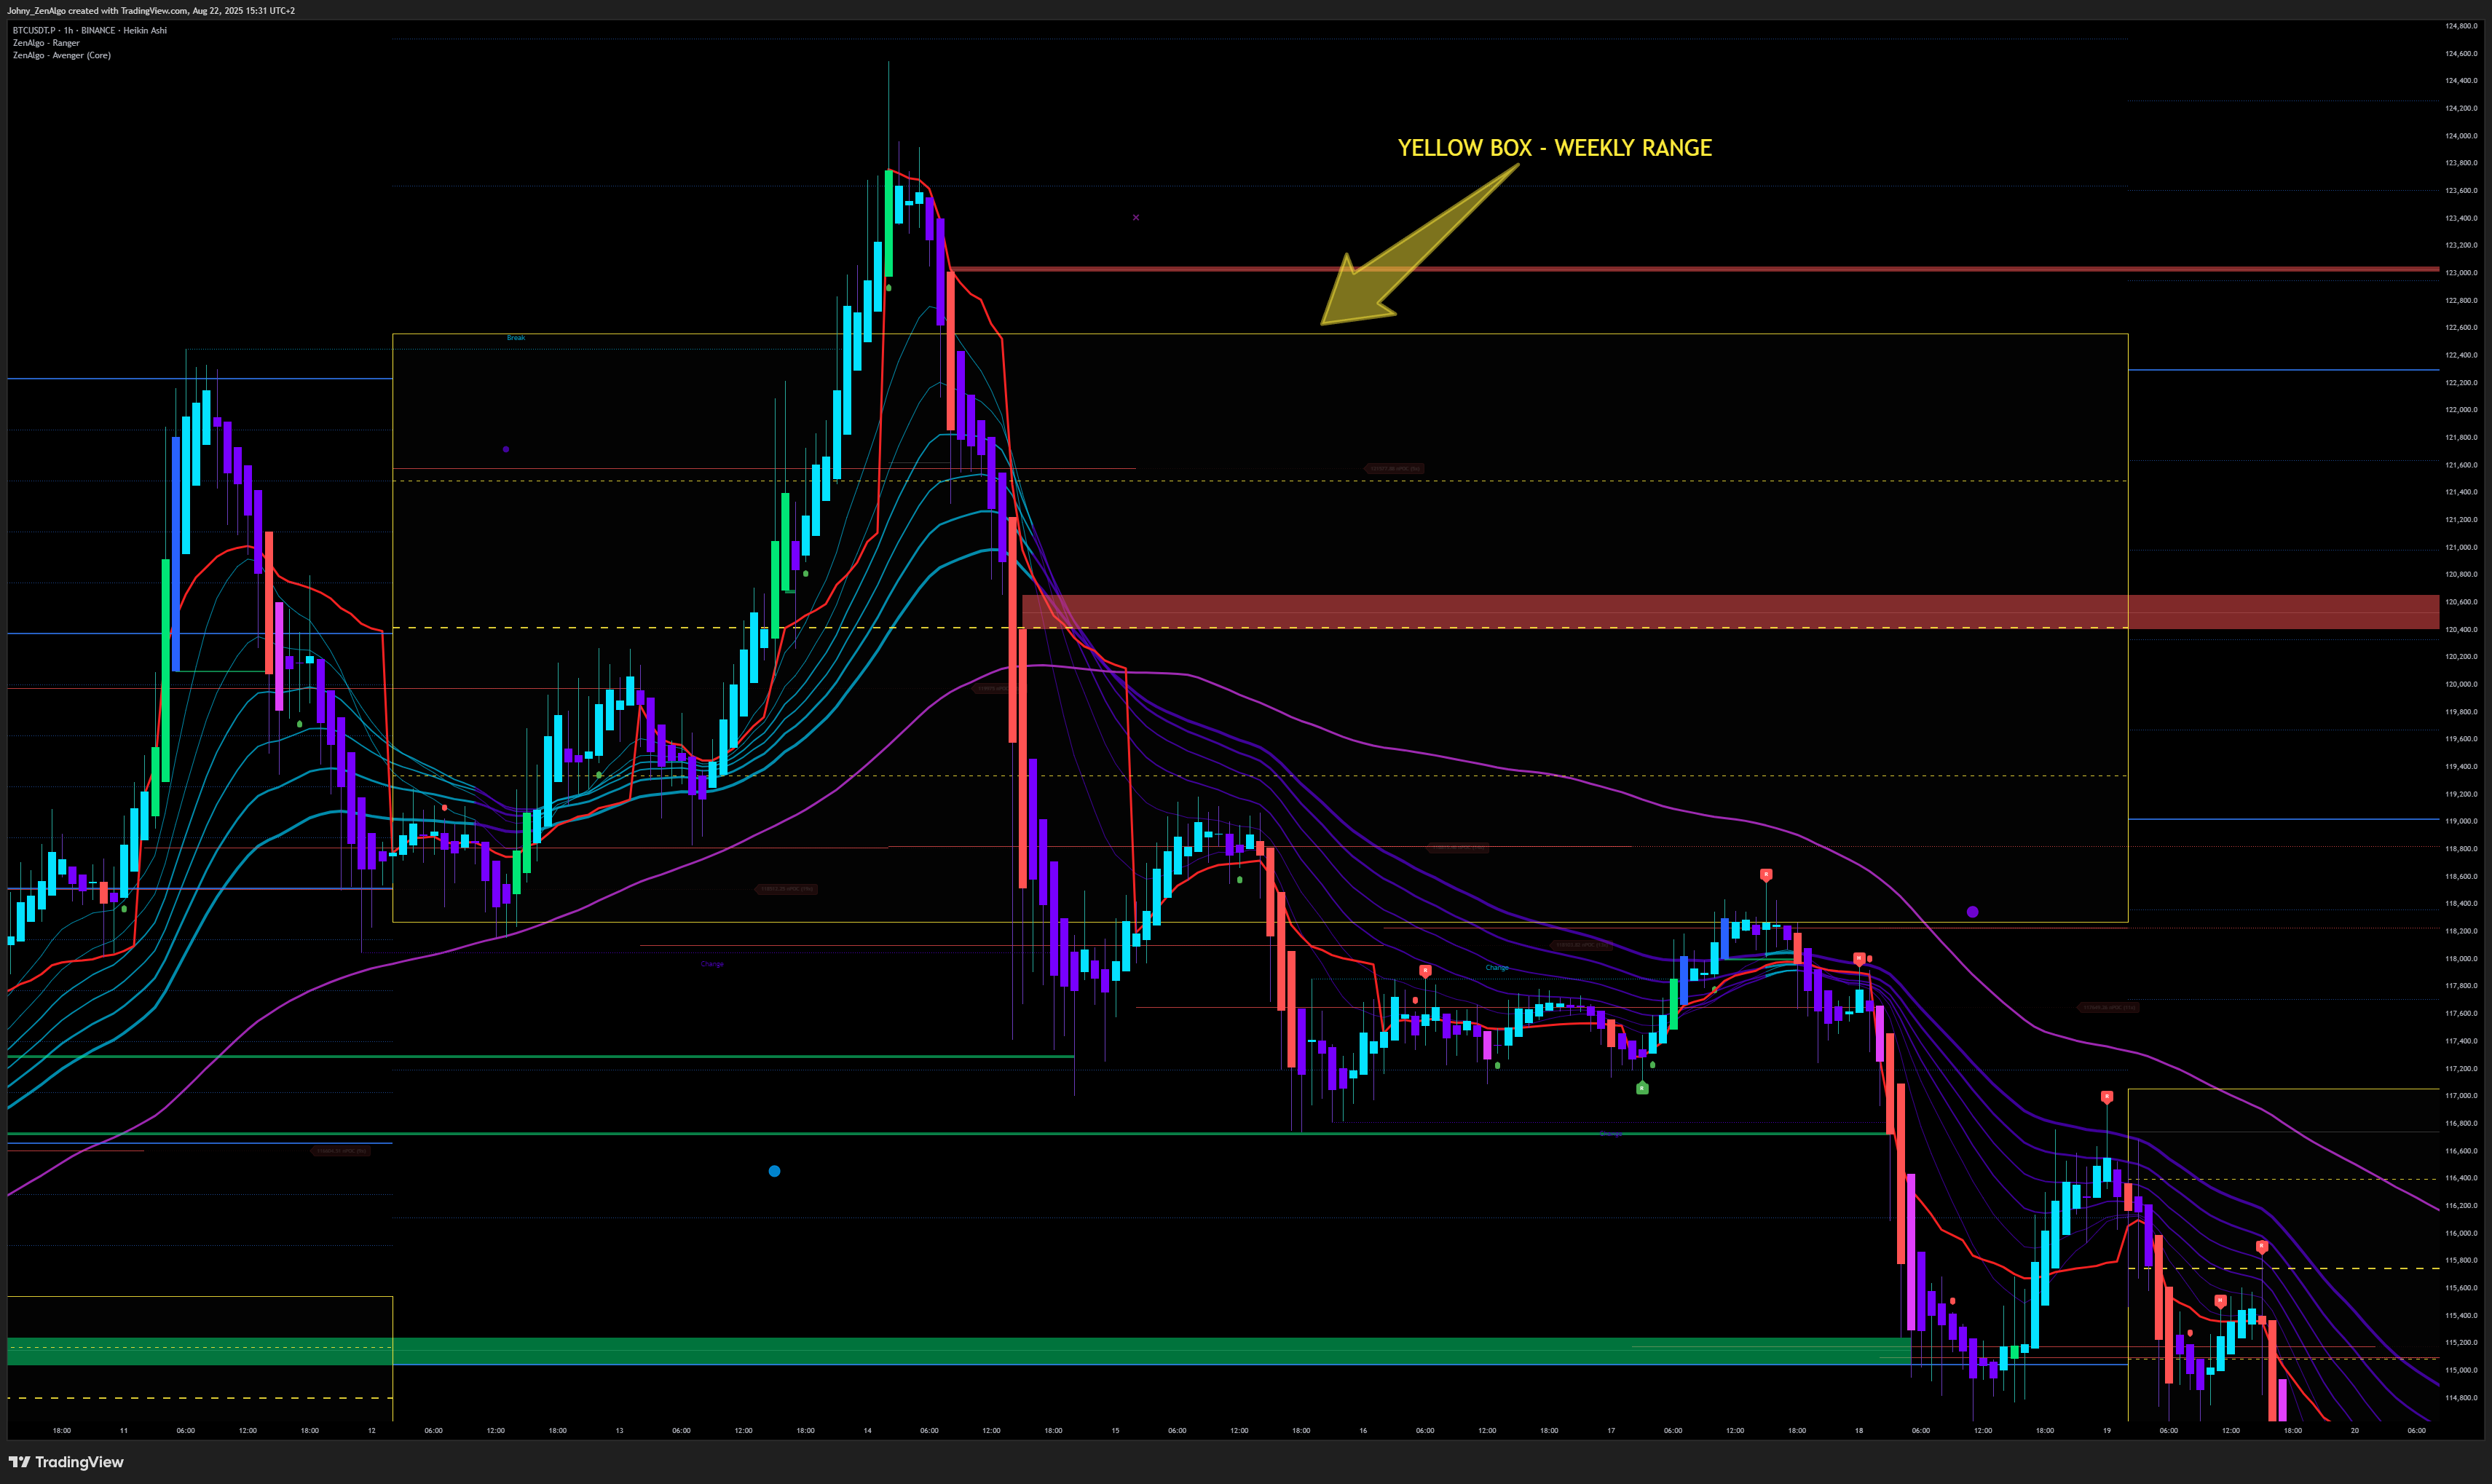
The Main Weekly Range
The golden box is the weekly VWAP range.
This is the most important zone to watch:
- Price often respects its edges
- A rejection from the box edge = strong reaction point
- A clean break through the box = trend continuation
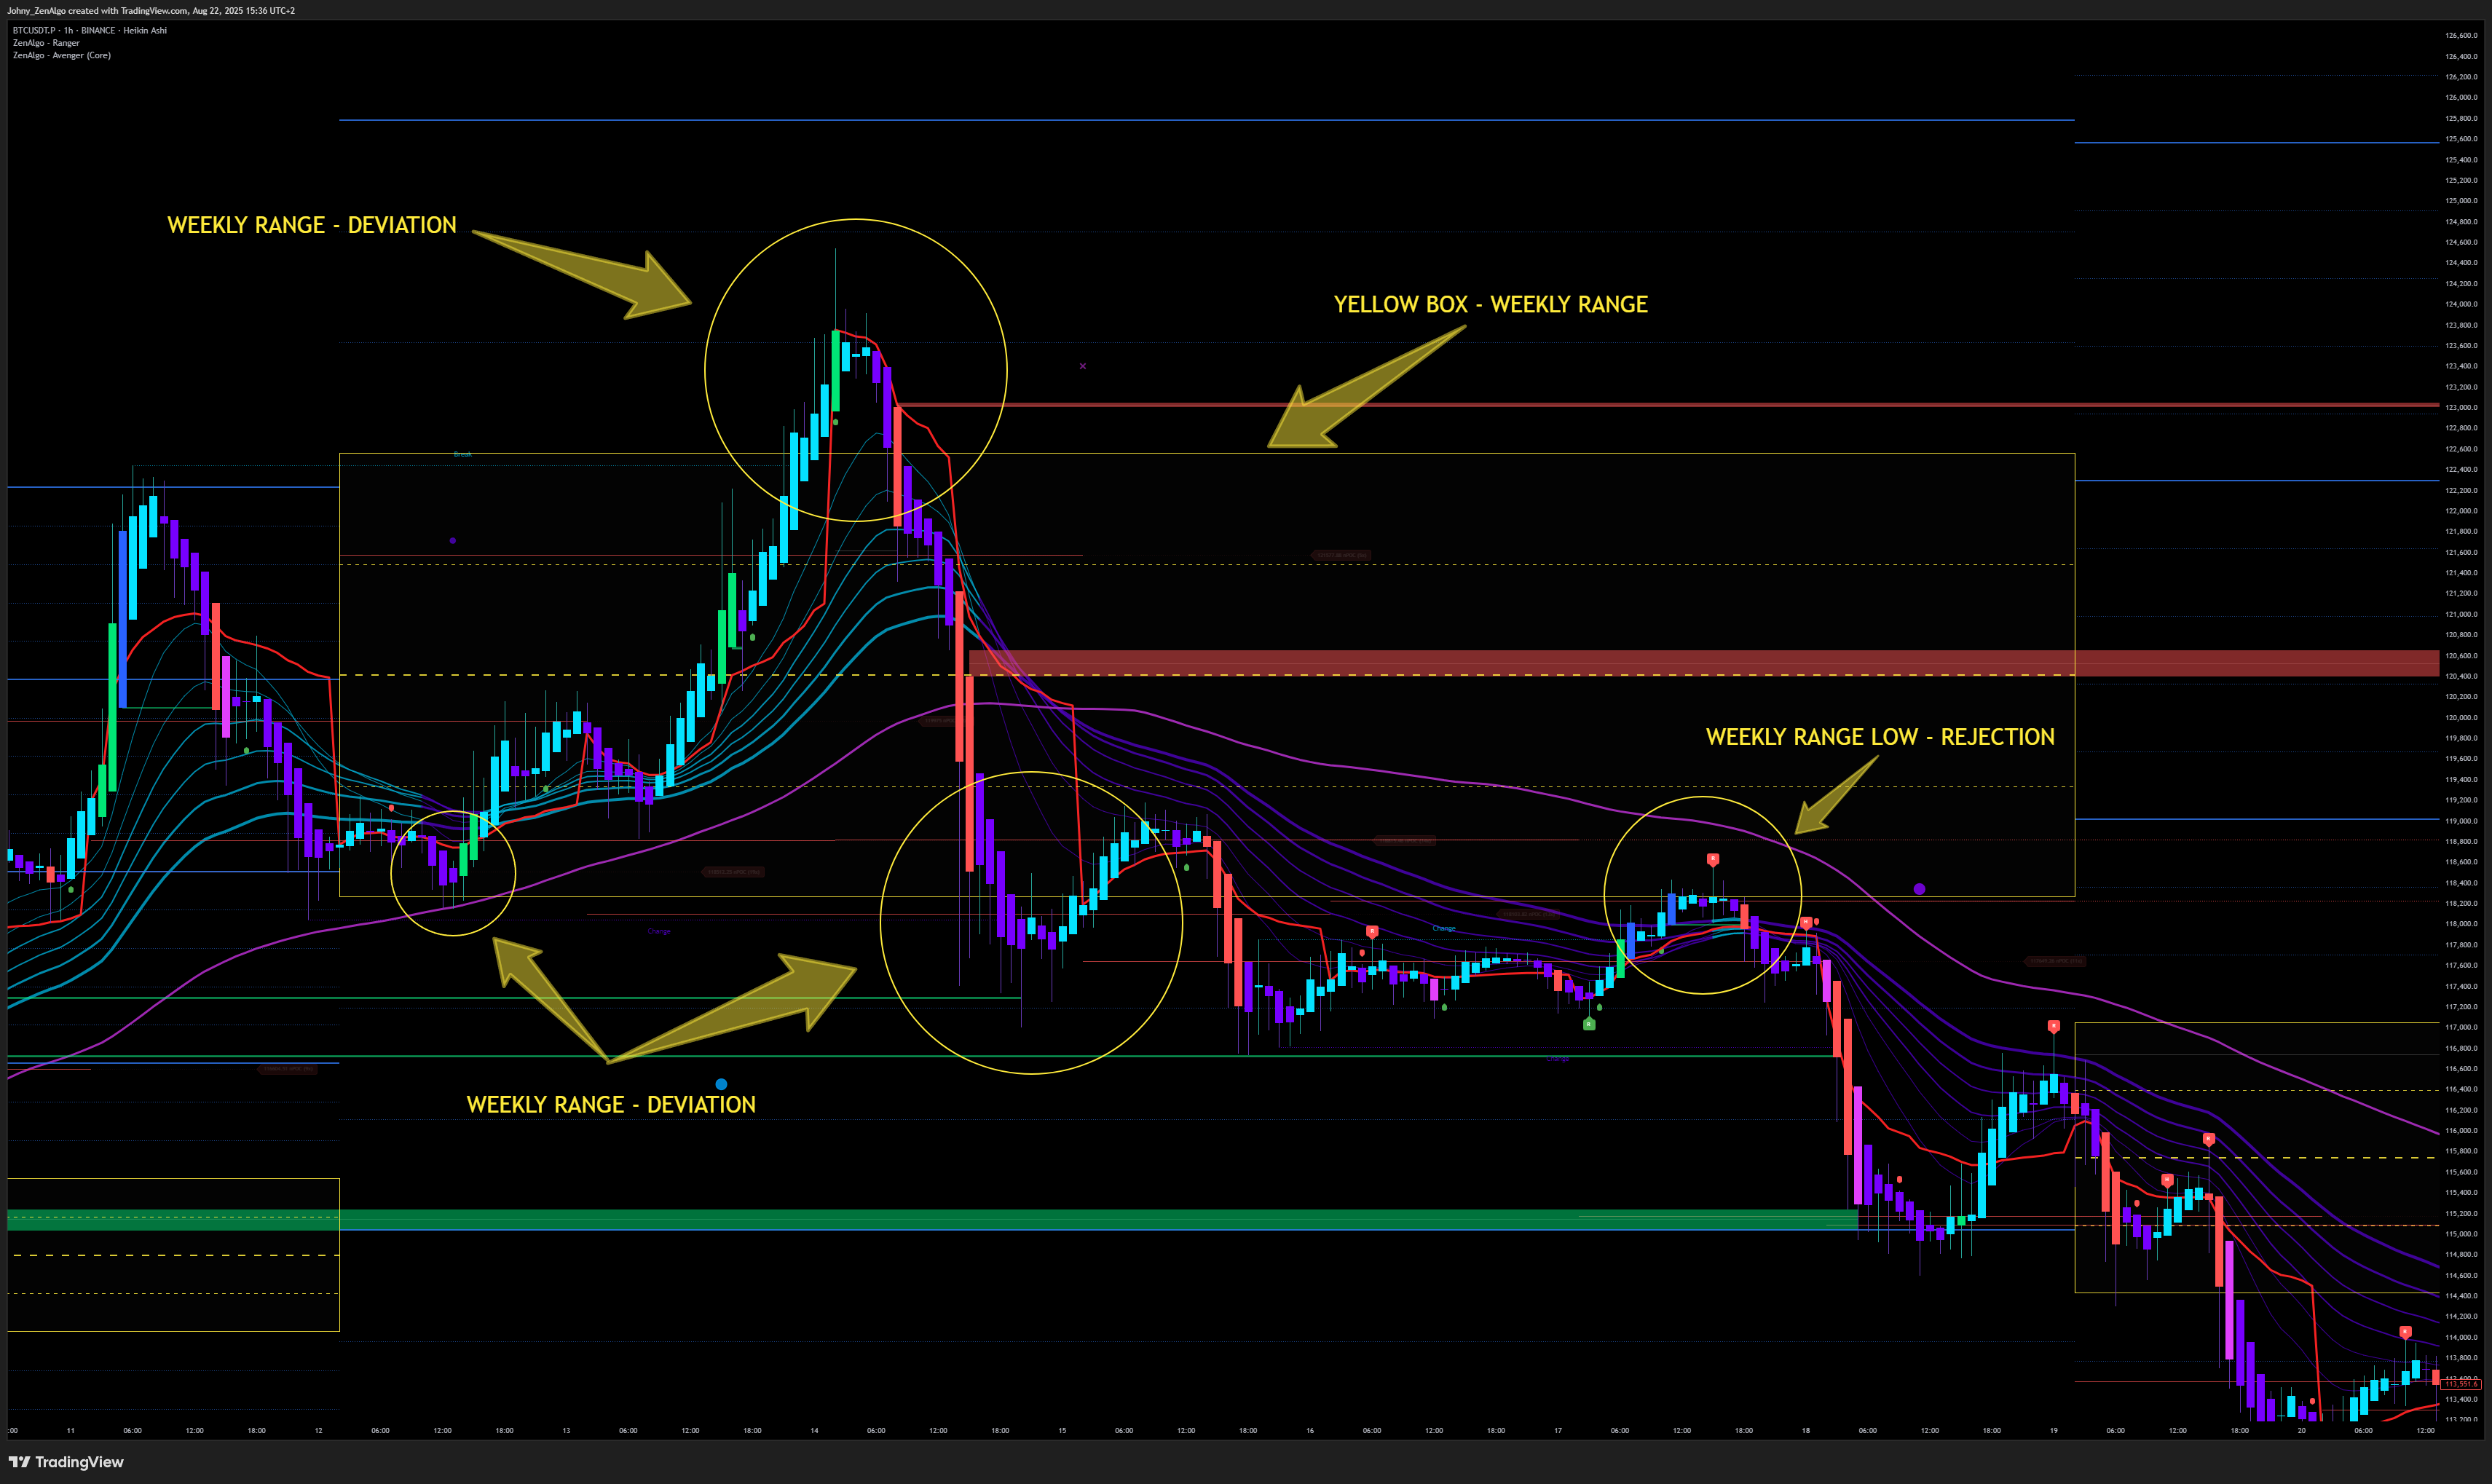
Deviations and Reactions
Often price will deviate from the range:
- Sometimes just a wick
- Sometimes full candles closing beyond the range
After deviation, two outcomes are common:
- Rejection → Price snaps back into the range → continuation toward the opposite edge
- Confirmation → Price retests the edge from the other side and holds → new trend continues
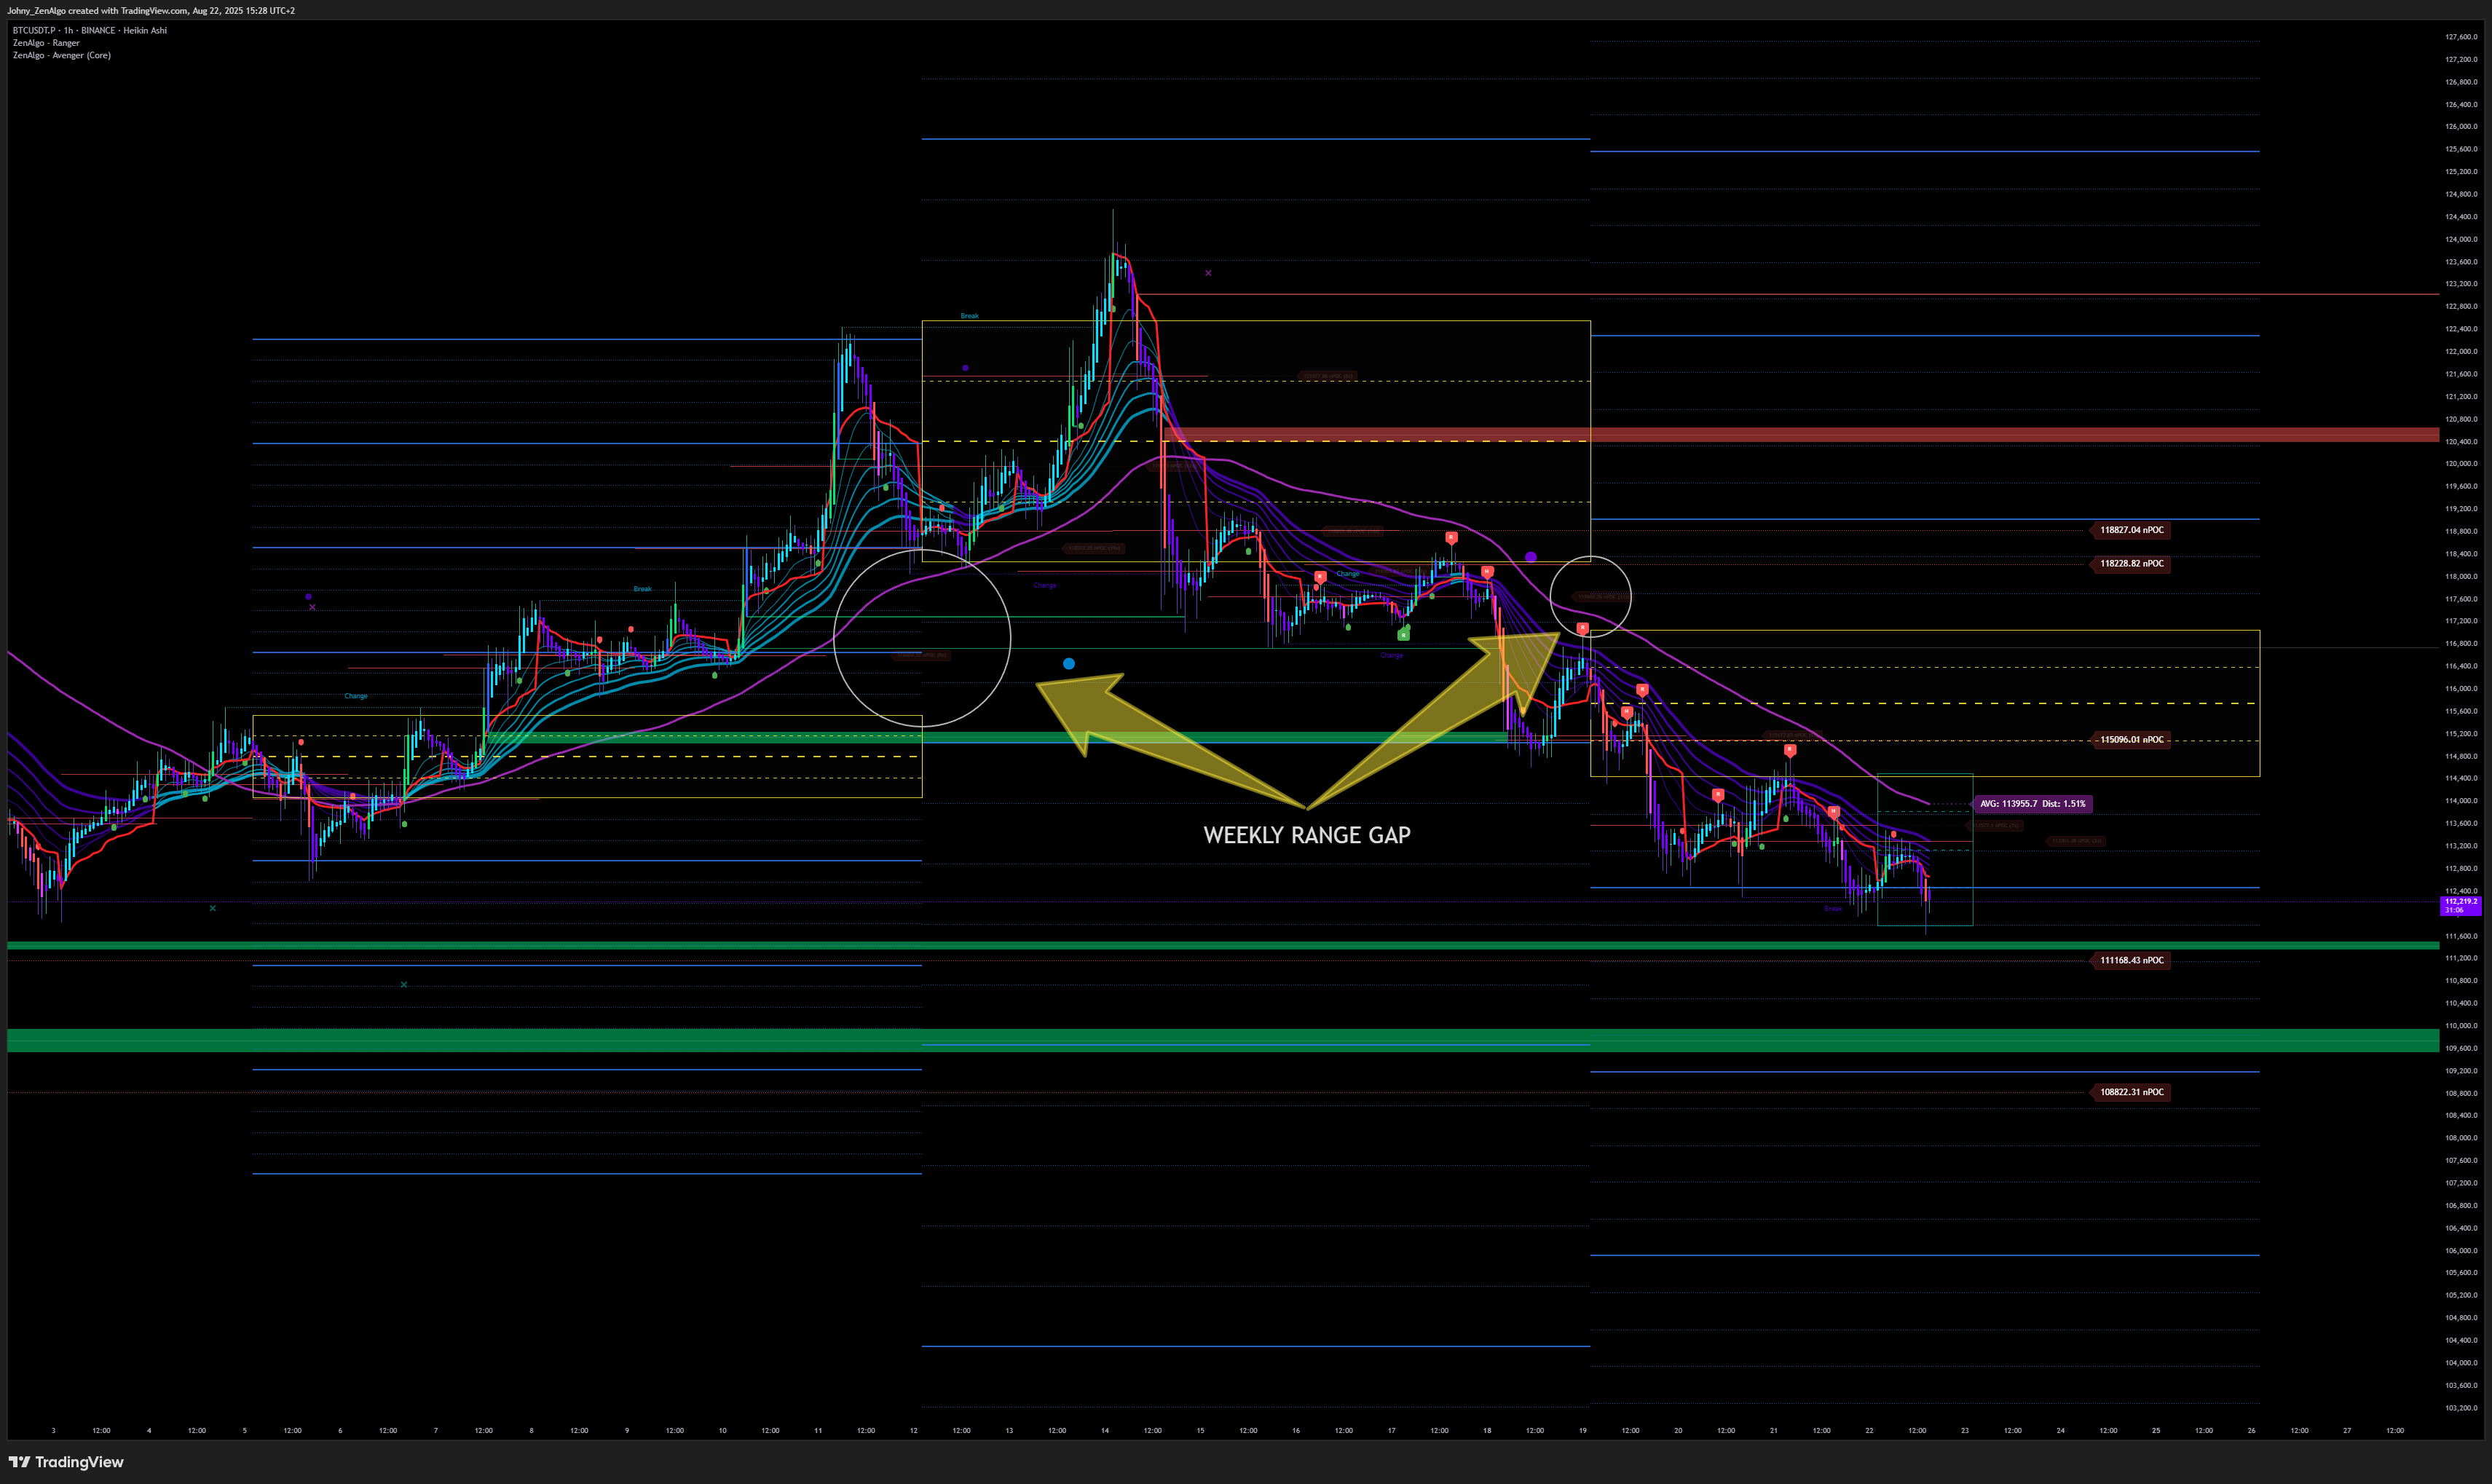
Range Gaps
Occasionally, a new weekly range does not overlap with the old one, creating a gap in between.
- These range gaps are highly significant
- Price often returns to them for liquidity
- They can either strengthen your confluence—or completely invalidate a setup if you ignore them
Always be aware of range gaps when analyzing context.
Every Asset Is Unique
While Ranger calculates levels consistently across markets, each coin has its own behavior.
That means you cannot assume all assets will react the same way:
- Some coins reject sharply at the weekly range edges
- Others respect mid-range levels or extended deviations
- Certain assets may frequently fill range gaps, while others ignore them
Use history. Scroll back and see how your asset reacts to Ranger levels. Some coins respect the mid-range or deviations more than others—adjust your expectations accordingly.
Practical Rule of Thumb
- Don't trade mid-range. The odds of reversal are low.
- Wait for edges. At range highs or lows, look for confirmation (e.g., bearish divergence for shorts).
With Ranger, you always know where you are on the map.
Next, we'll use this context to refine Step 2 of the strategy.
Strategy Step 2: Build Your Map with Ranger
Once you've confirmed the higher-timeframe trend (Step 1), switch down to your 3m/5m chart and plot your Ranger levels.
This gives you the “map” for your intraday navigation.
What to identify on your map:
- Range High / Range Low - the golden box edges (weekly VWAP range)
- Mid-Range - optional midpoint, depending on how the asset respects it historically
- Weekly Low - reference level from higher timeframe context
- Deviation Edges - prior deviations where price failed to hold
- Range Gaps - untested zones between old and new weekly ranges
👉 The key question: Where is price right now on this map?
- At a range edge? → high interest zone
- Mid-range? → usually not tradable, wait for edges
- Approaching a prior deviation/gap? → context to watch carefully
Strategy Step 3: Wait for Price to Reach a Key Level
Trading is not about forcing entries—it's about waiting for price to come to your area of interest.
-
If price is mid-range → Don't trade yet.
- Set alerts at the levels you identified in Step 2 (range high/low, deviations, gap edges).
- Let the chart call you when it's time—don't waste mental energy staring endlessly.
-
If price is already at a key level → Great, conditions are set.
- We can now move to the next step: looking for confirmation (divergence, rejection, or continuation setups).
📌 At this stage, your goal is simple:
- Have your map built with Ranger
- Know your position on the map
- Be ready to act when price reaches the important zones
Additional Concepts with Avenger
On lower timeframes (3m/5m) Avenger gives us several additional tools that can help refine entries and confirm trends.
These concepts also work on higher timeframes when you want extra context.
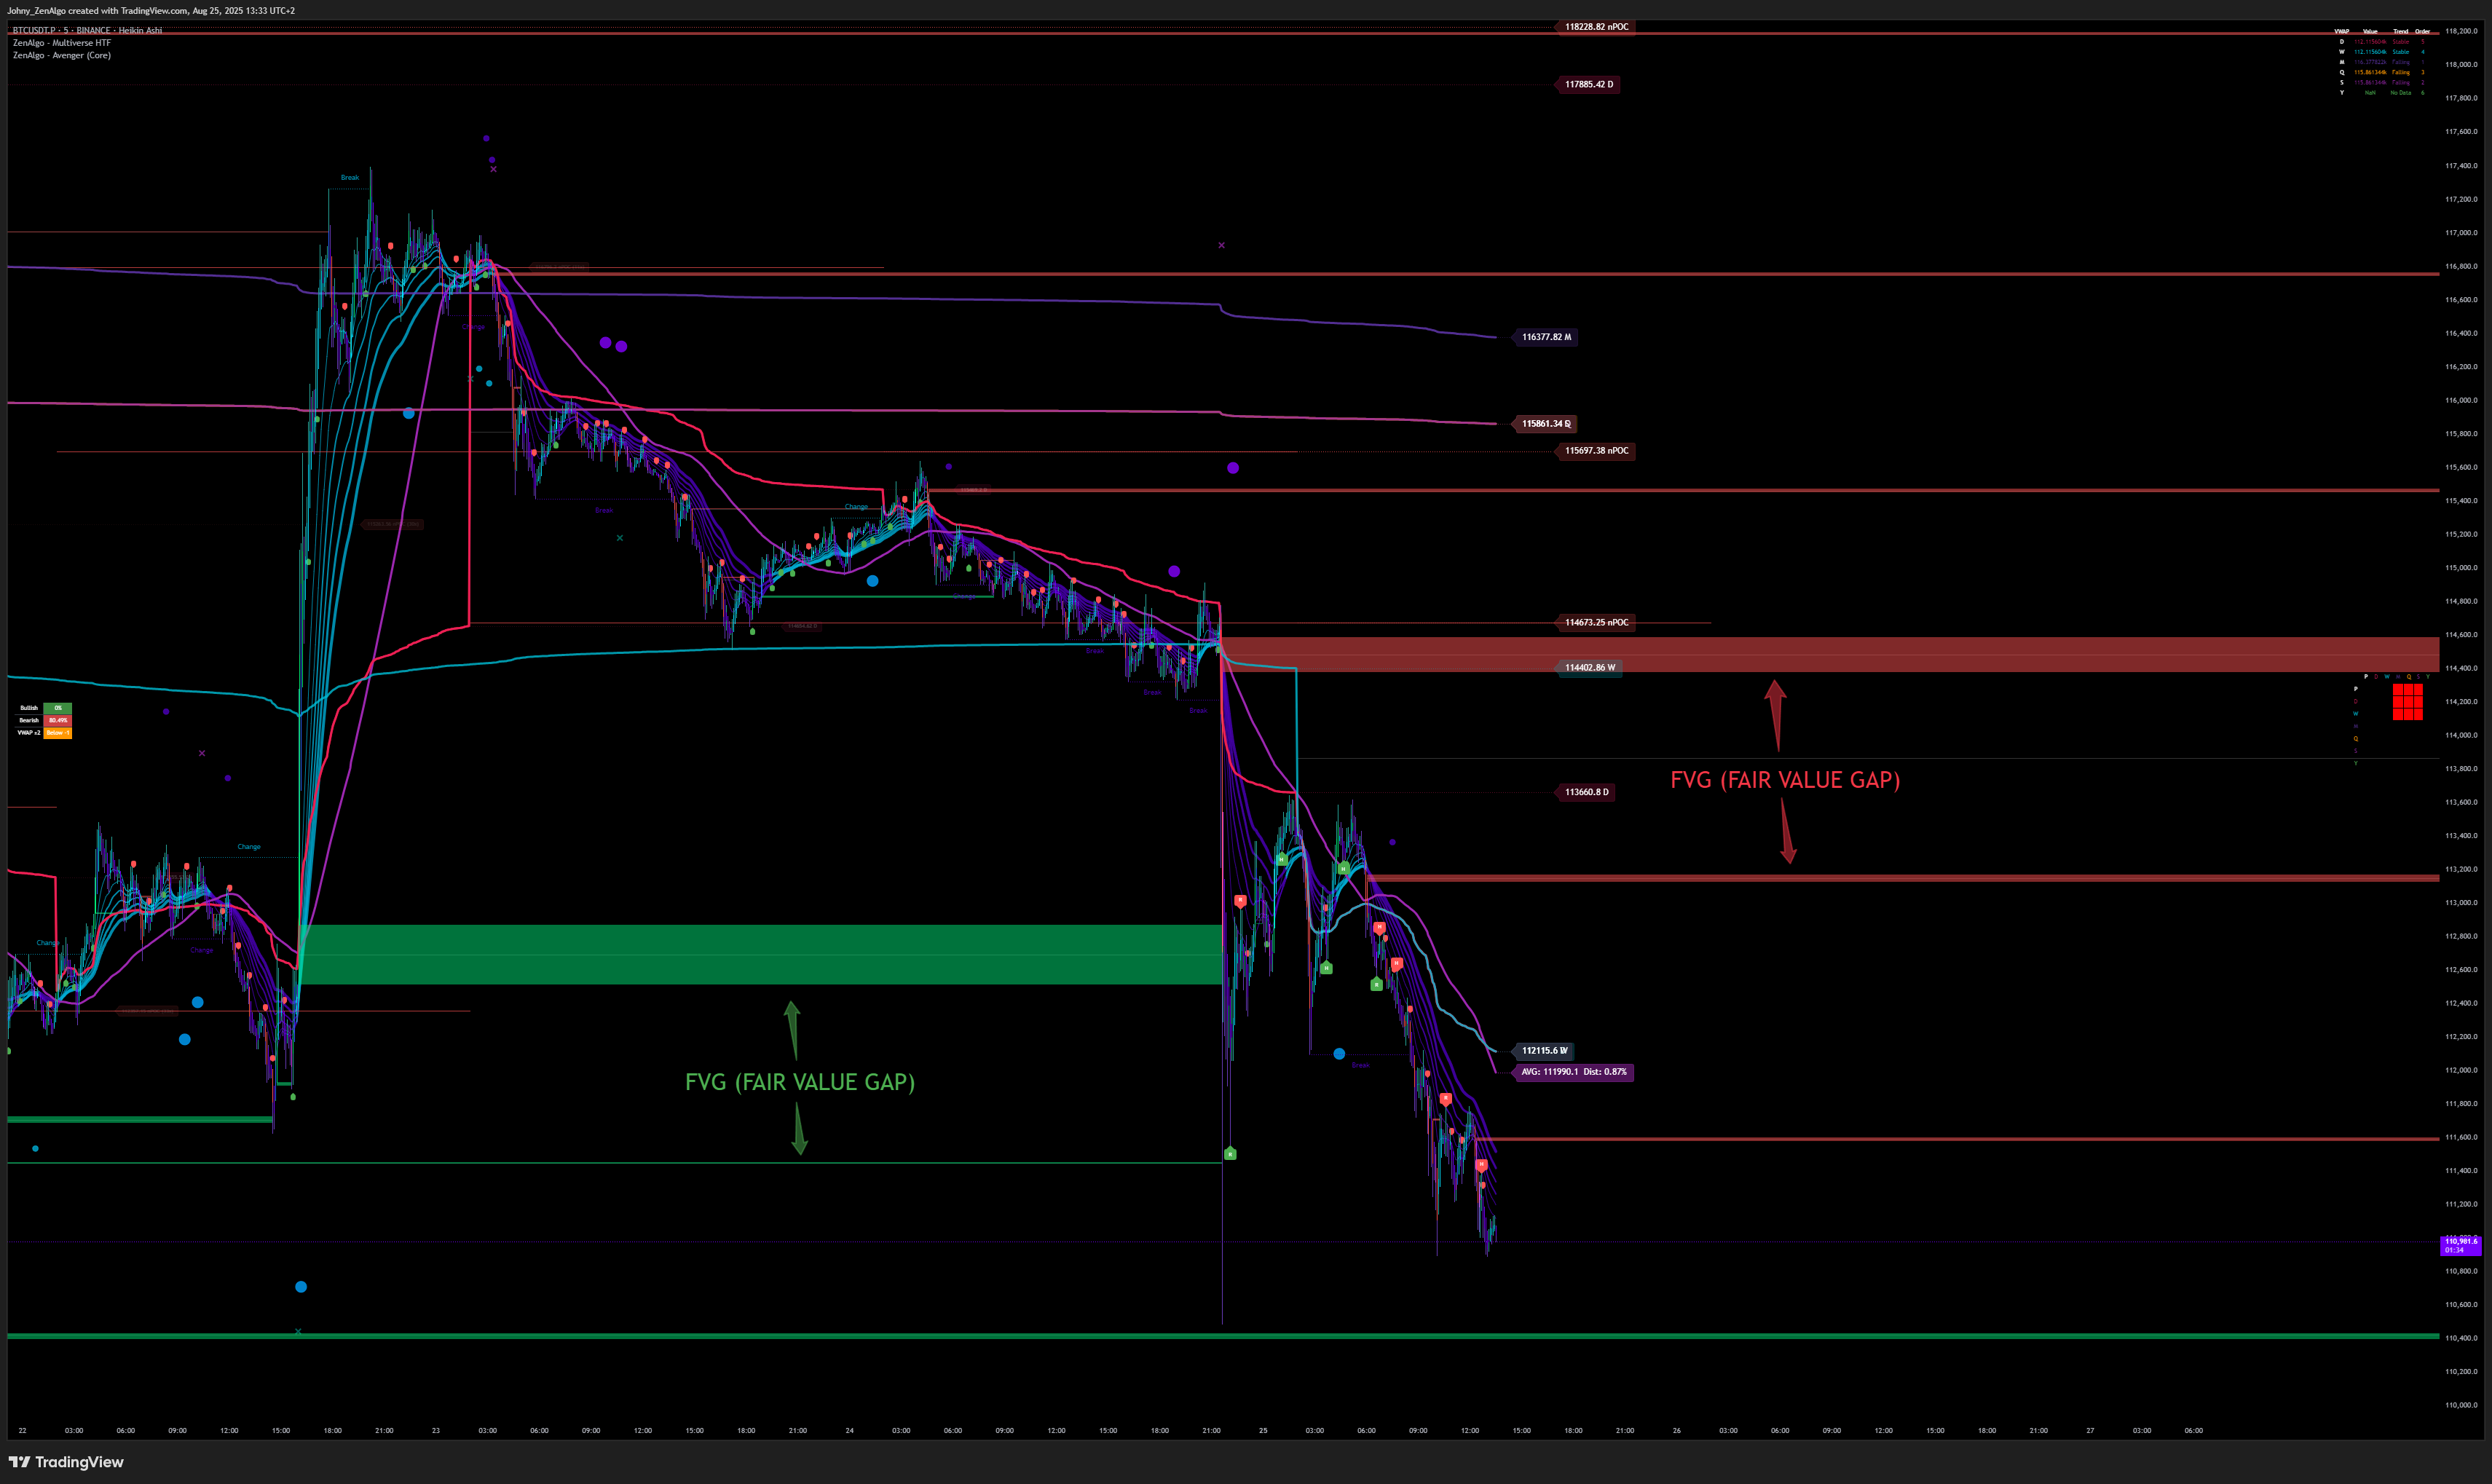
Fair Value Gaps (FVG)
Sometimes price moves so quickly that it skips levels, leaving behind a gap.
These are shown as FVG zones on the chart.
- Large FVGs → high probability price will revisit them
- Small FVGs → lower probability, but still worth noting
- Not a strict rule, but a useful guide: markets often seek to “fill in” these gaps before continuing
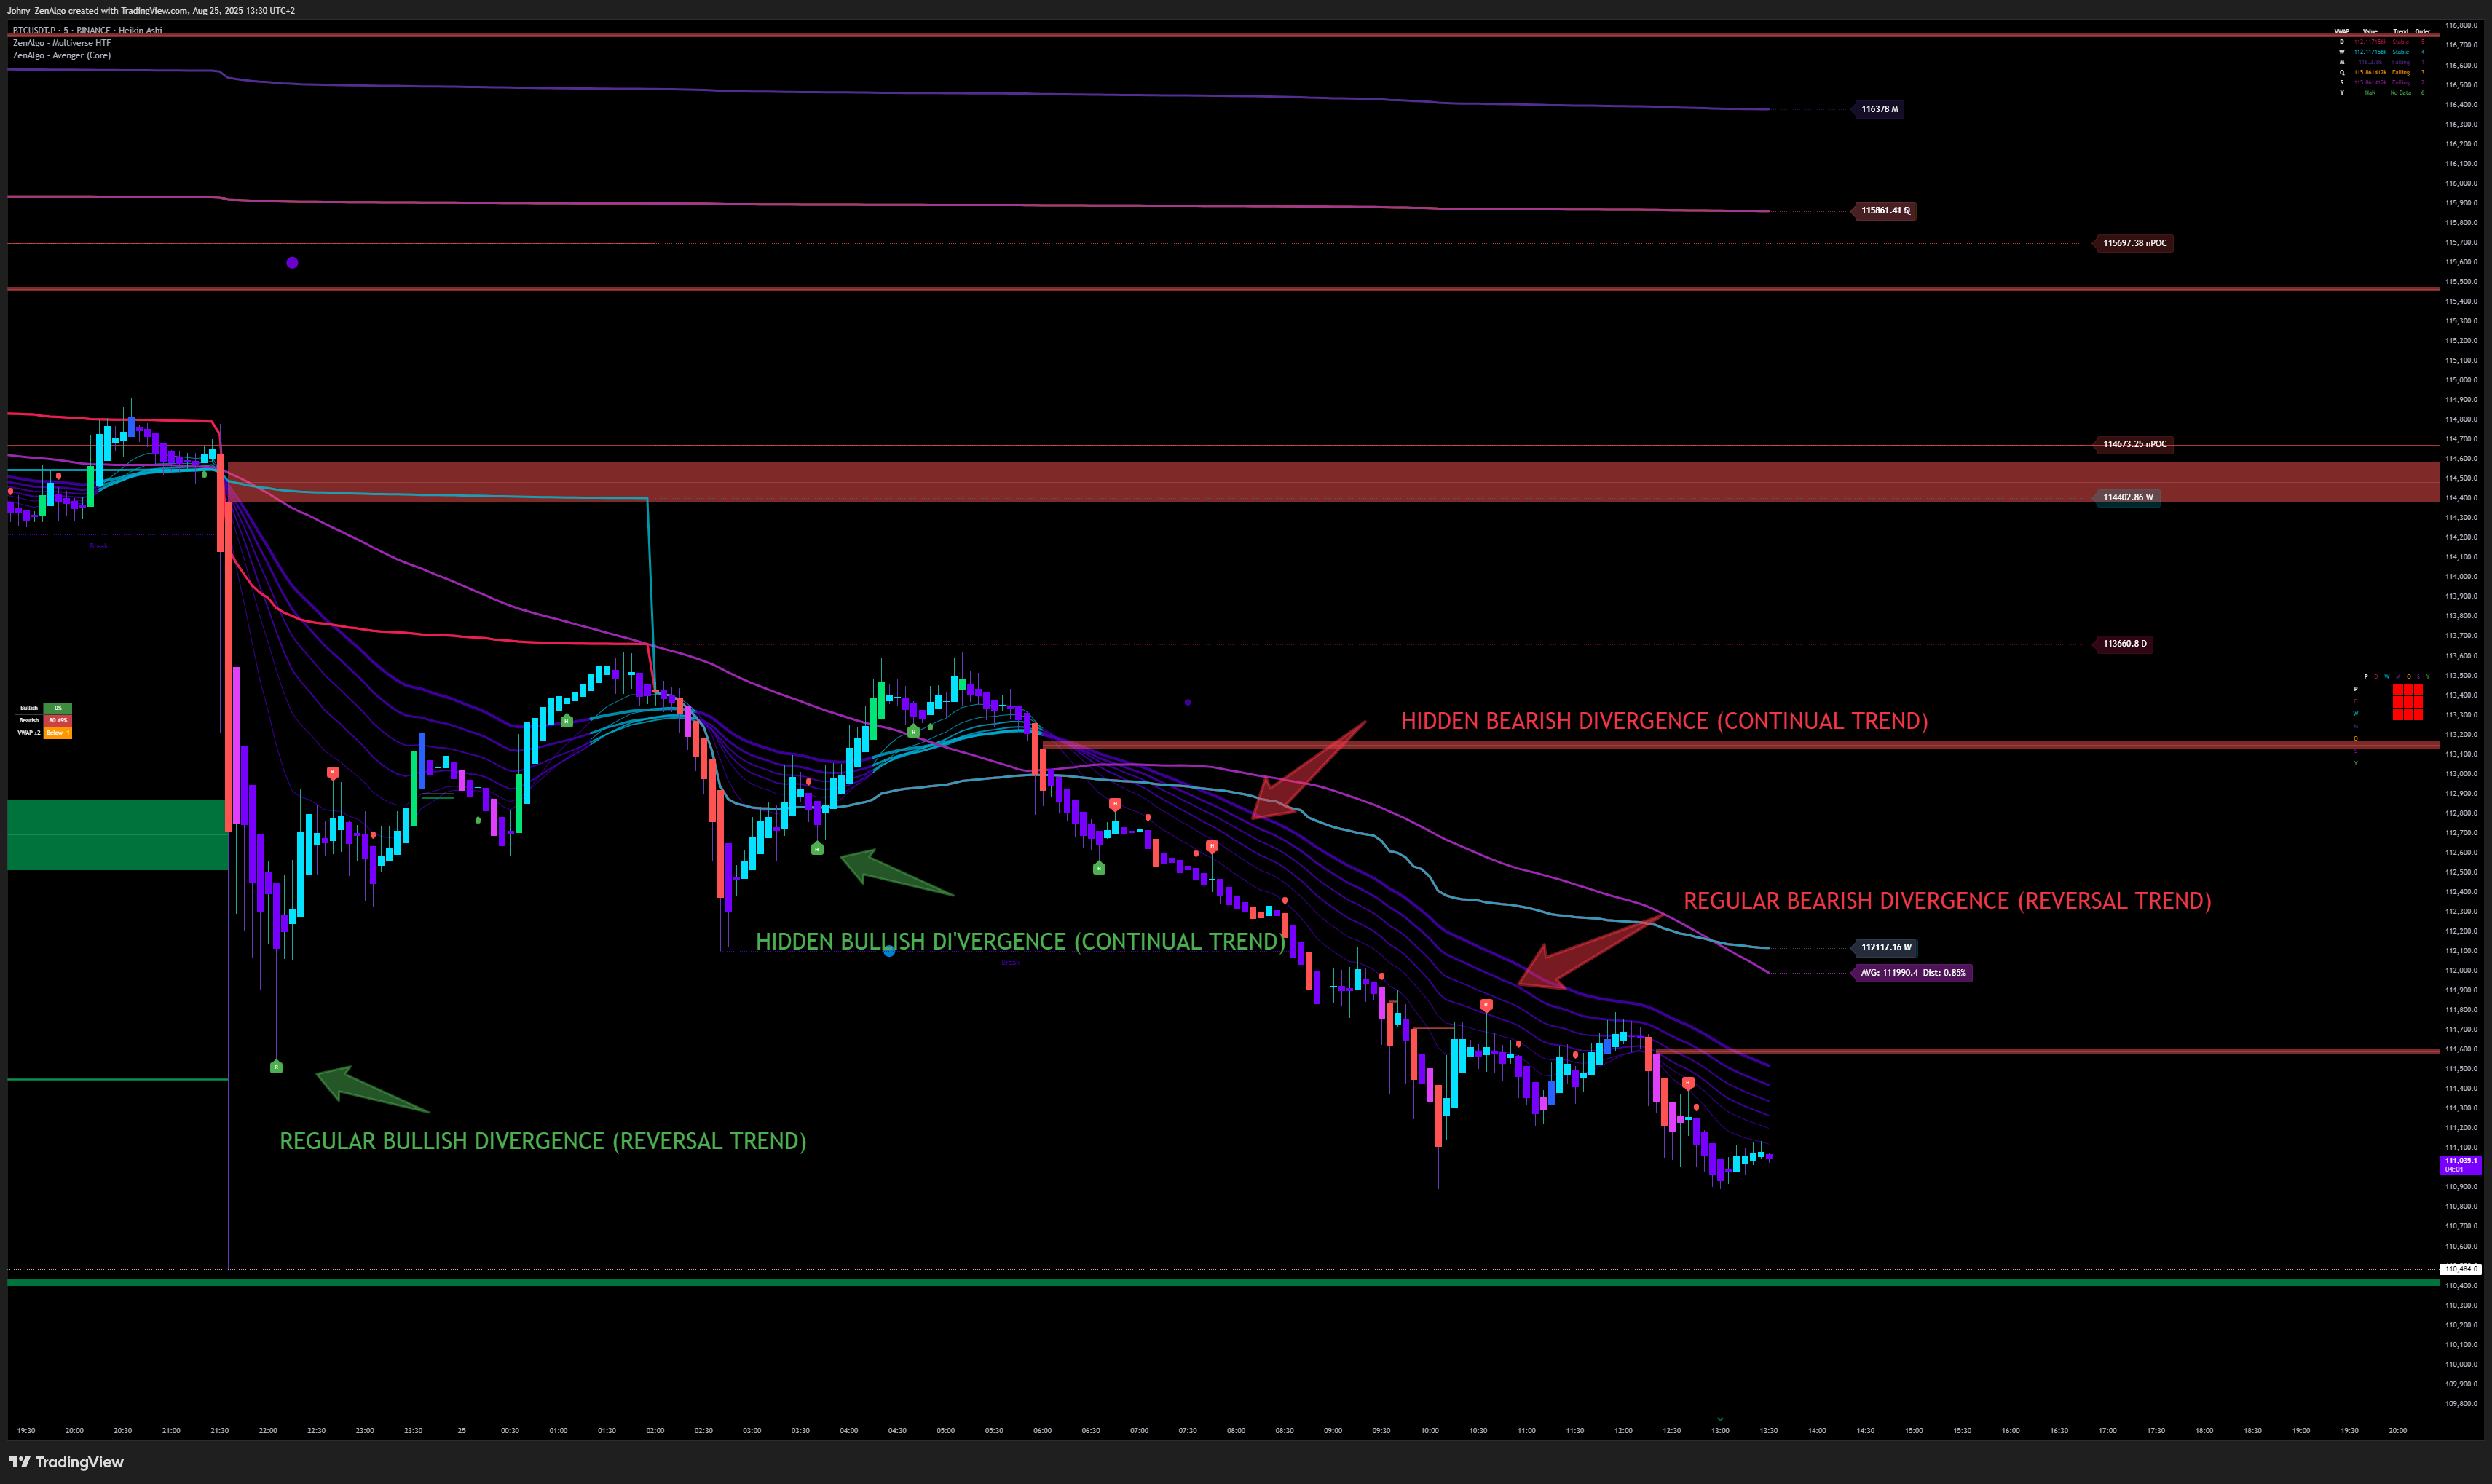
Divergence Labels
Avenger automatically calculates Delta divergences in the background and marks them with red and green labels:
- Red labels = bearish divergences (sell pressure dominates)
- Green labels = bullish divergences (buy pressure dominates)
In a downtrend, you will often see many red labels:
- Price pushes up temporarily
- But Delta shows selling pressure is increasing
- The rally fails and price continues lower
These labels are not standalone trade signals, but they are a great visual aid when identifying trend strength and potential turning points.
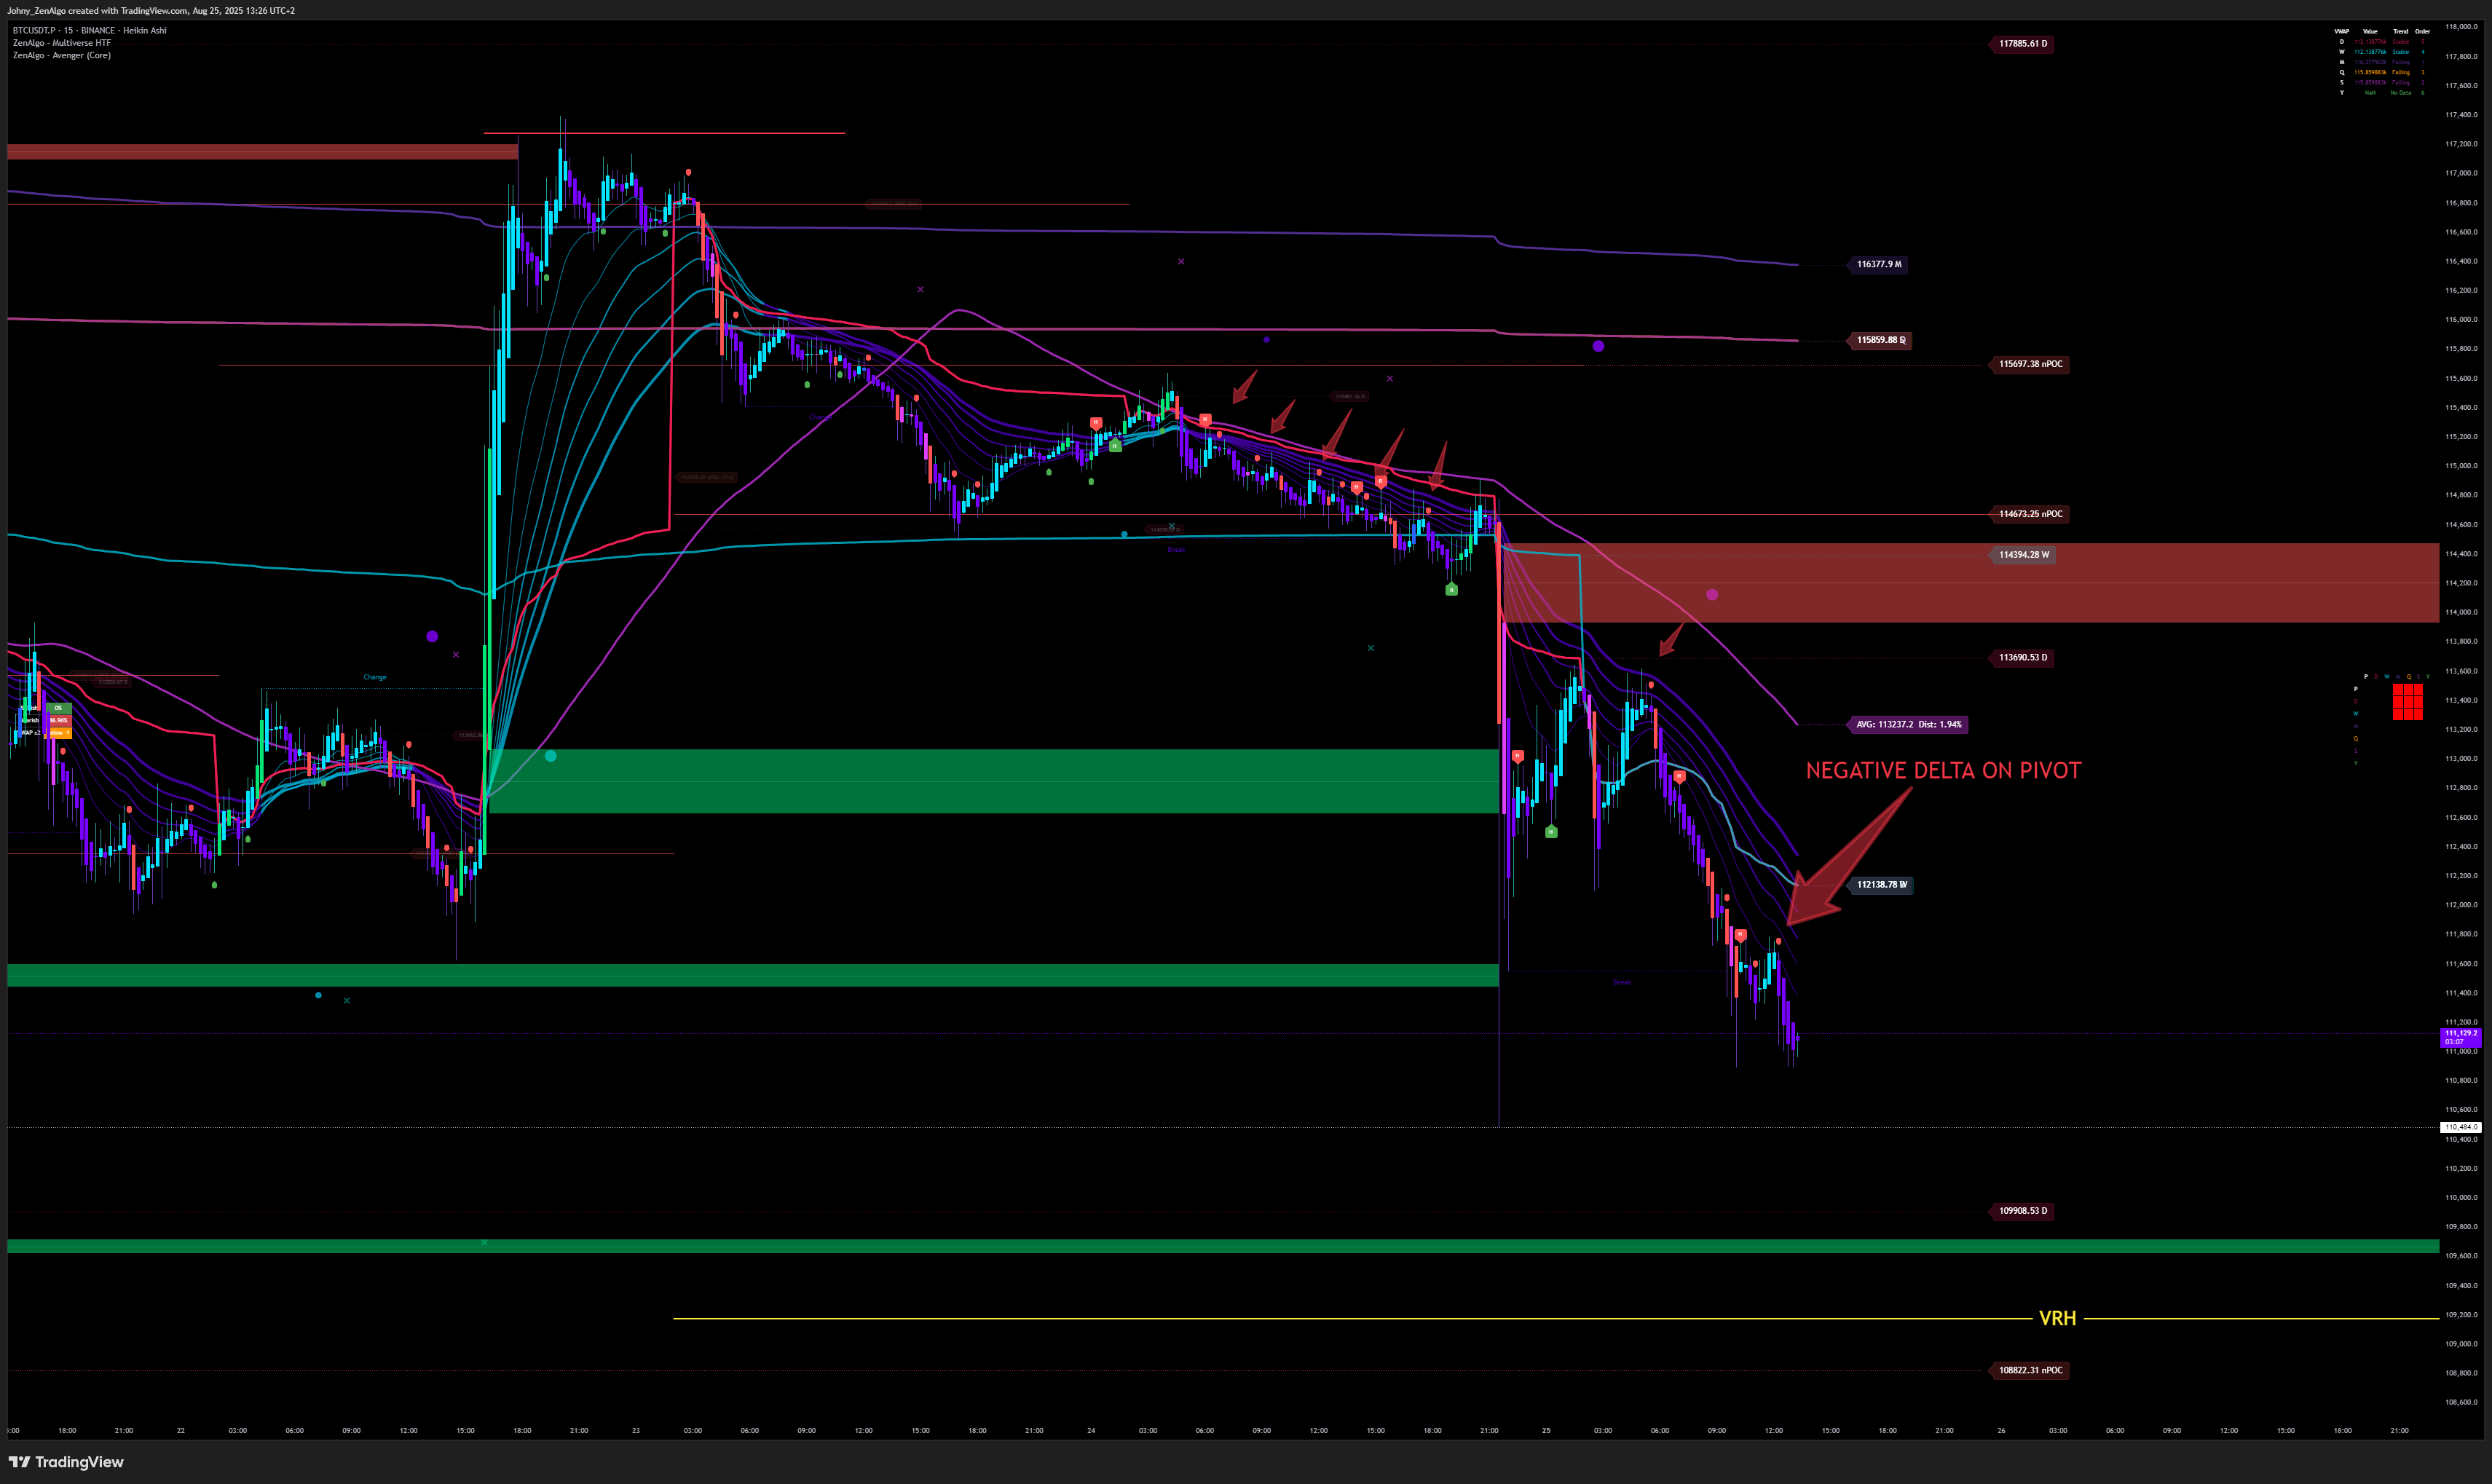
Pivot Points with Delta
Avenger also plots small red and green dots — pivot markers.
These are based on shifts in Delta:
- Red dot = negative Delta increasing (sell pressure rising) → potential bearish pivot
- Green dot = positive Delta increasing (buy pressure rising) → potential bullish pivot
These pivots:
- Often mark local turning points
- Are especially powerful in confluence with other indicators or levels
- Can be used both for identifying entry zones and for confirming trend strength
How to Use This in the Strategy
- FVGs → Watch for price returning to fill the gap. A rejection inside the gap zone adds weight to your setup.
- Divergence Labels → Use as confirmation that the trend pressure matches your directional bias.
- Pivot Points → Look for confluence with range edges, VWAPs, or divergence setups.
👉 These are not signals on their own. They are contextual tools that strengthen your confidence when aligned with the core principles of the strategy.
Strategy Step 4: Look for Bearish Divergence on Delta
This is the core condition of our short-only strategy.
If there is no bearish divergence on Delta → there is no trade.
What to Look For
On the Delta indicator:
- Price makes higher highs
- Delta makes lower highs (or lower lows)
- This mismatch = bearish divergence → buying pressure is weakening while price is still pushing up
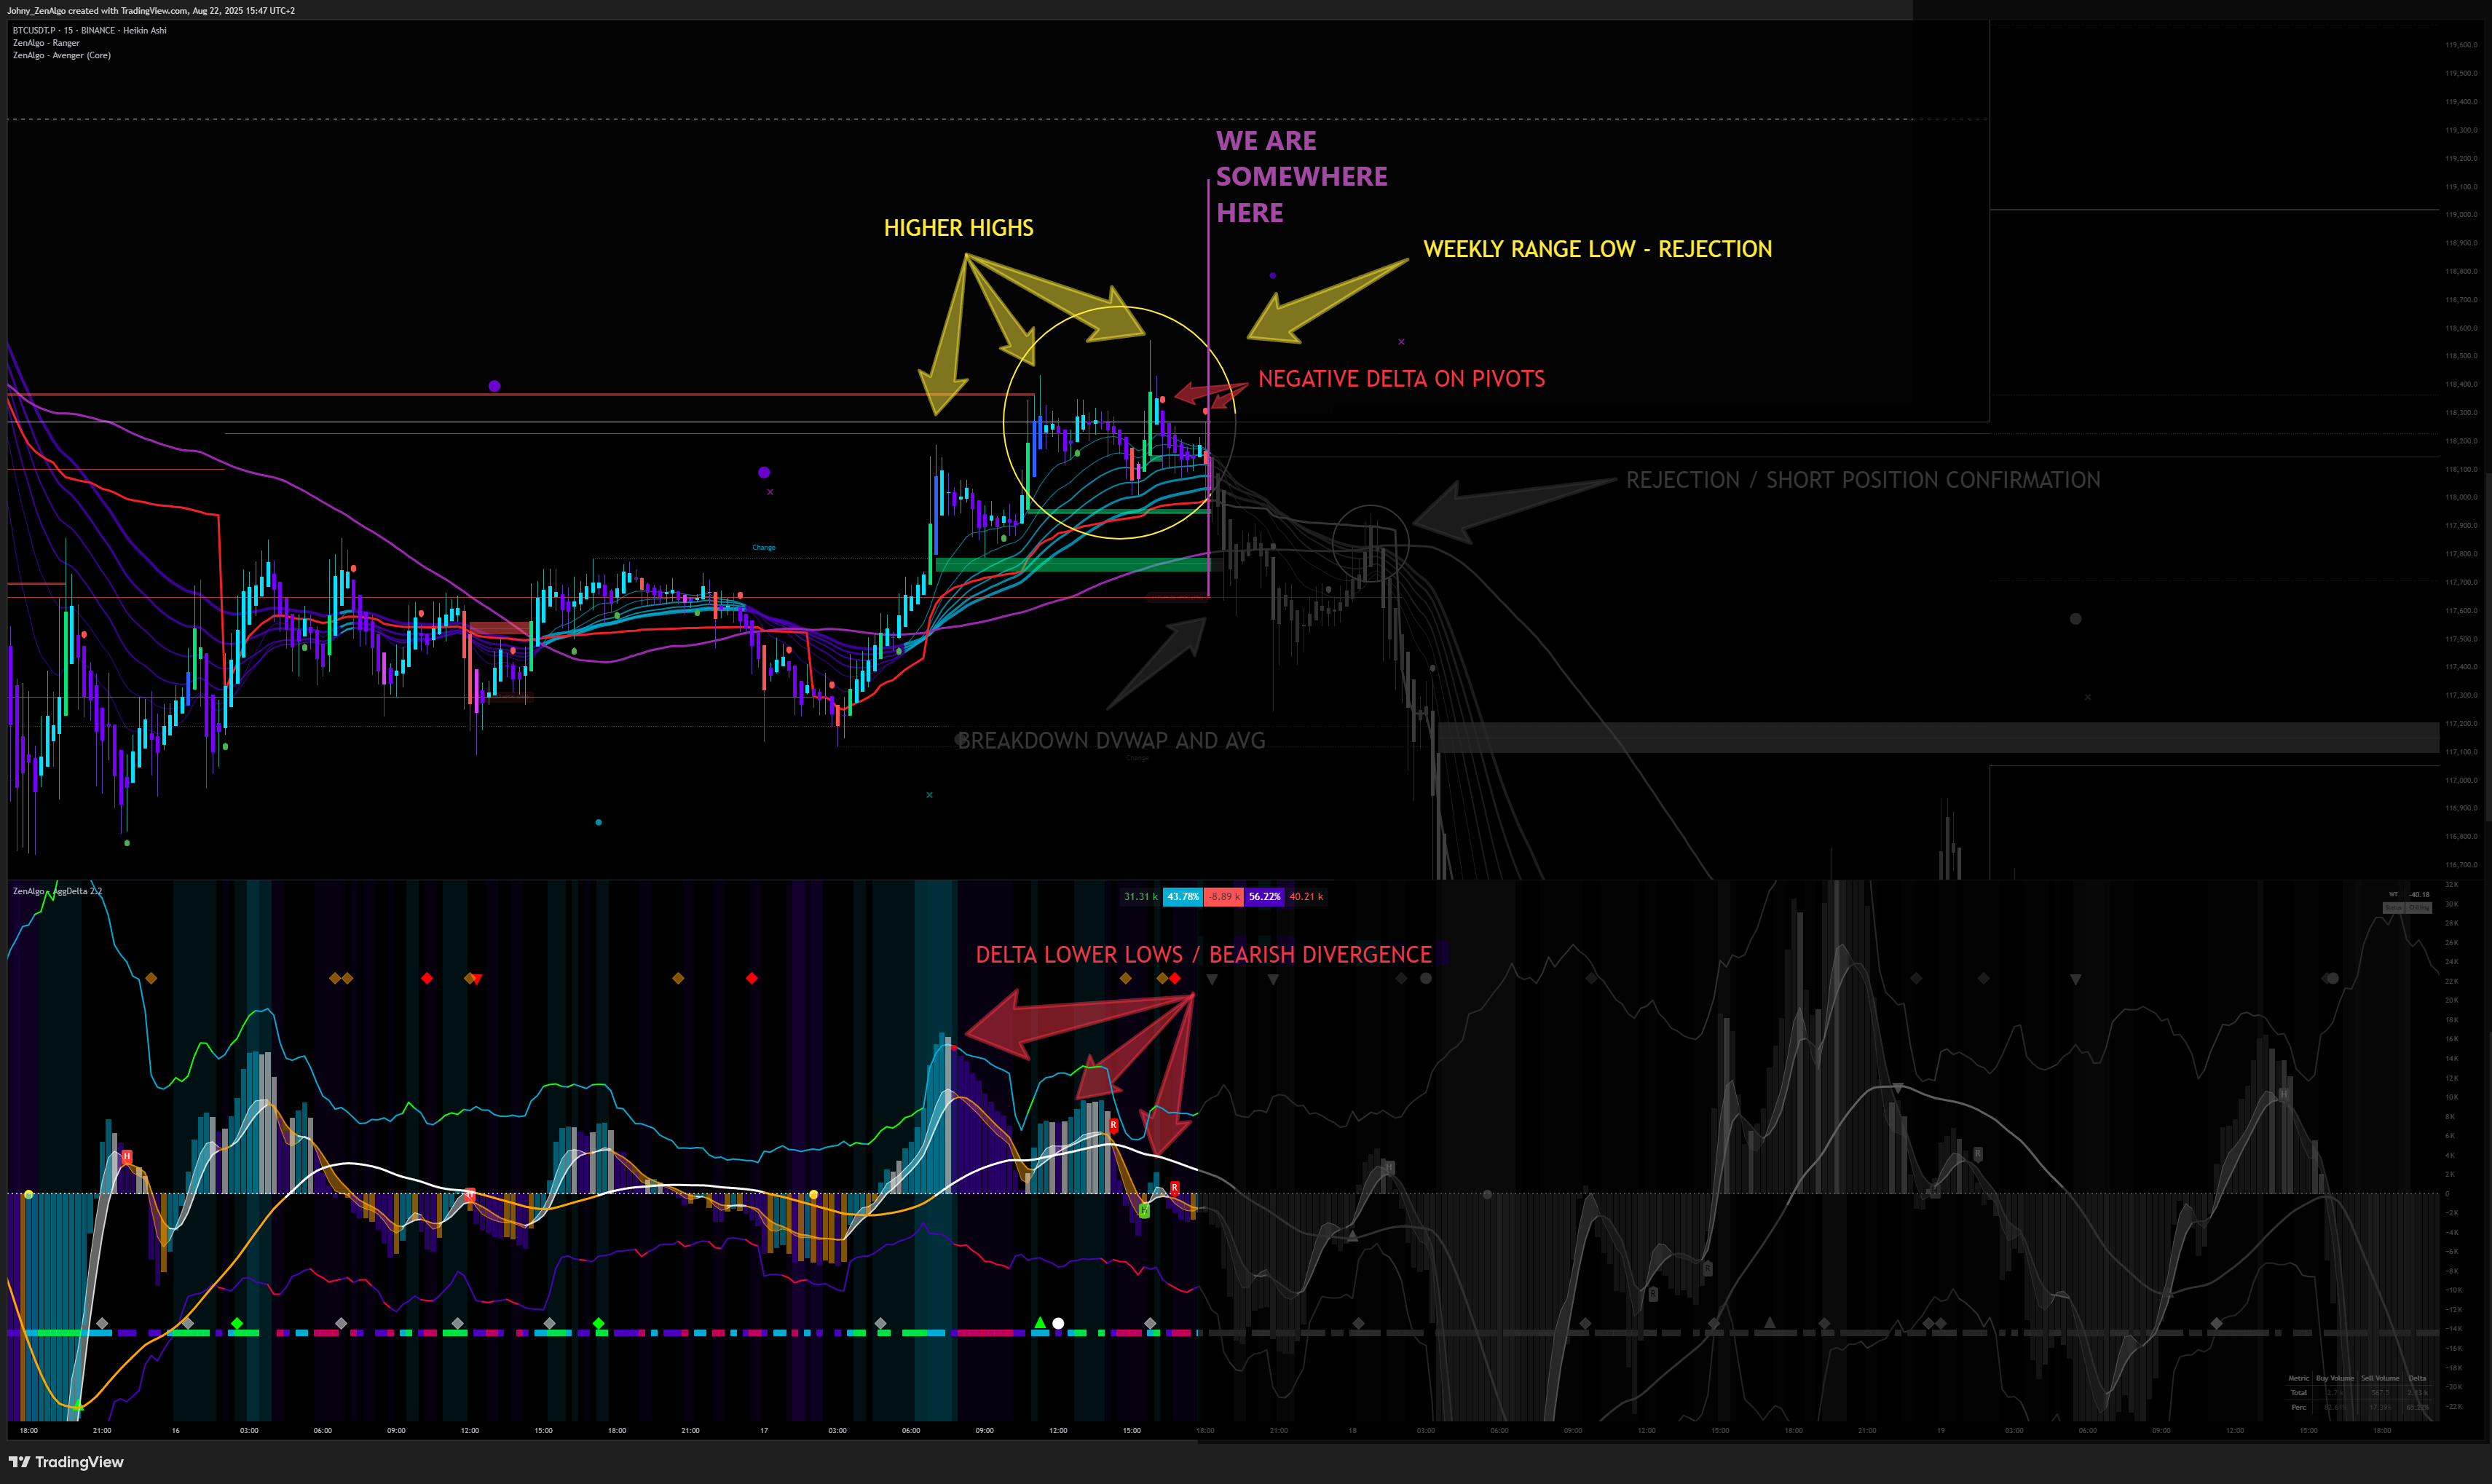
Why Divergence Matters
Divergence tells you that the trend is losing strength.
Price may still climb higher for a while, but the underlying data (volume flow) shows that buyers are exhausted.
This is the signal to prepare for a move in line with the higher timeframe downtrend.
Clarifying the Timeframe Logic
Earlier we said: we don't trade reversals, we go with the trend.
That rule still stands—on the higher timeframe (1h) we always trade with the trend.
So why do we look for divergences that seem like reversals?
Because on the lower timeframe (3m/5m) they only look like reversals.
In reality, they are just pullbacks failing and then continuing in the direction of the HTF trend.
Think of it this way:
- On 1h: confirmed downtrend
- On 5m: price makes a temporary push upward (a local “reversal”)
- Delta shows divergence (buyers exhausted)
- Price then rejects and continues downward → this is a continuation trade with the HTF
Why Not Just Short Anywhere in the Downtrend?
If the 1h is already in a downtrend, why not just open shorts randomly?
Because we don't want to guess—we want evidence.
Divergence at a key level gives us:
- A concrete reason to enter
- Better probability of success
- Clear risk/reward (RRR), since we enter at a logical point where invalidation is nearby
Without divergence, you are just hoping the market continues. With divergence, you have data-backed confirmation that the HTF trend is likely to resume.
👉 This is why divergence is the core entry condition of the strategy.
It aligns the lower timeframe trigger with the higher timeframe trend, creating a high-probability trade setup.
(We'll discuss risk/reward (RRR) more in the next sections.)
Confluence Checklist
Bearish divergence is the mandatory condition.
But strong setups come when multiple pieces of evidence align. Look for:
- ✅ Domina uptrend → Capital flowing out of alts
- ✅ 1h downtrend confirmed with Avenger
- ✅ Price at key level (range high/low, deviation edge, gap edge, FVG zone)
- ✅ Avenger confirmation:
- Negative Delta dots (pivot points)
- Red divergence labels
- Break & retest of AVG line
- ✅ Reaction at range/FVG (rejection instead of continuation)
The more of these conditions line up, the higher the probability your trade works out.
A Reality Check
This might look like a lot of work to follow. That's because it is.
Trading is not simple, but the market provides endless opportunities.
Once you internalize this workflow:
- Scanning a chart and ticking off the checklist will take only a few seconds
- Recognizing setups becomes second nature
- The edge comes not from one “magic signal,” but from stacking multiple confirmations
👉 At this stage, you are almost ready to take the trade.
But don't enter yet—we still need to cover a few final conditions before execution.
Strategy Step 5: Wait for the Retrace and Confirmation
Now we've reached the break point.
Everything signals that the local up-move is exhausted and the reversal is beginning.
At this moment, many traders would already jump into a short position.
But not us. Our strategy is stricter—we want higher certainty.
The Common Mistake
-
Impatient trader: Enters right after the first drop.
- Feels great for a moment.
- But then price retraces, erasing the unrealized profit.
- The trader panics and closes the position at breakeven or a small loss.
-
Disciplined trader (you): Waits for the retrace and rejection.
- Recognizes the temporary bounce as part of the setup.
- Waits for price to reject clearly from a level (range edge, AVG, or FVG).
- Enters after confirmation, not before.
👉 This way, you avoid the fake entries and catch the real move.
What We Wait For
-
Price Action Rejection
- Price breaks down, pulls back (retrace), then rejects from a key level.
- Ideal rejection is a clean bounce down from the AVG or range edge.
- A vector candle through the level makes the rejection even stronger.
-
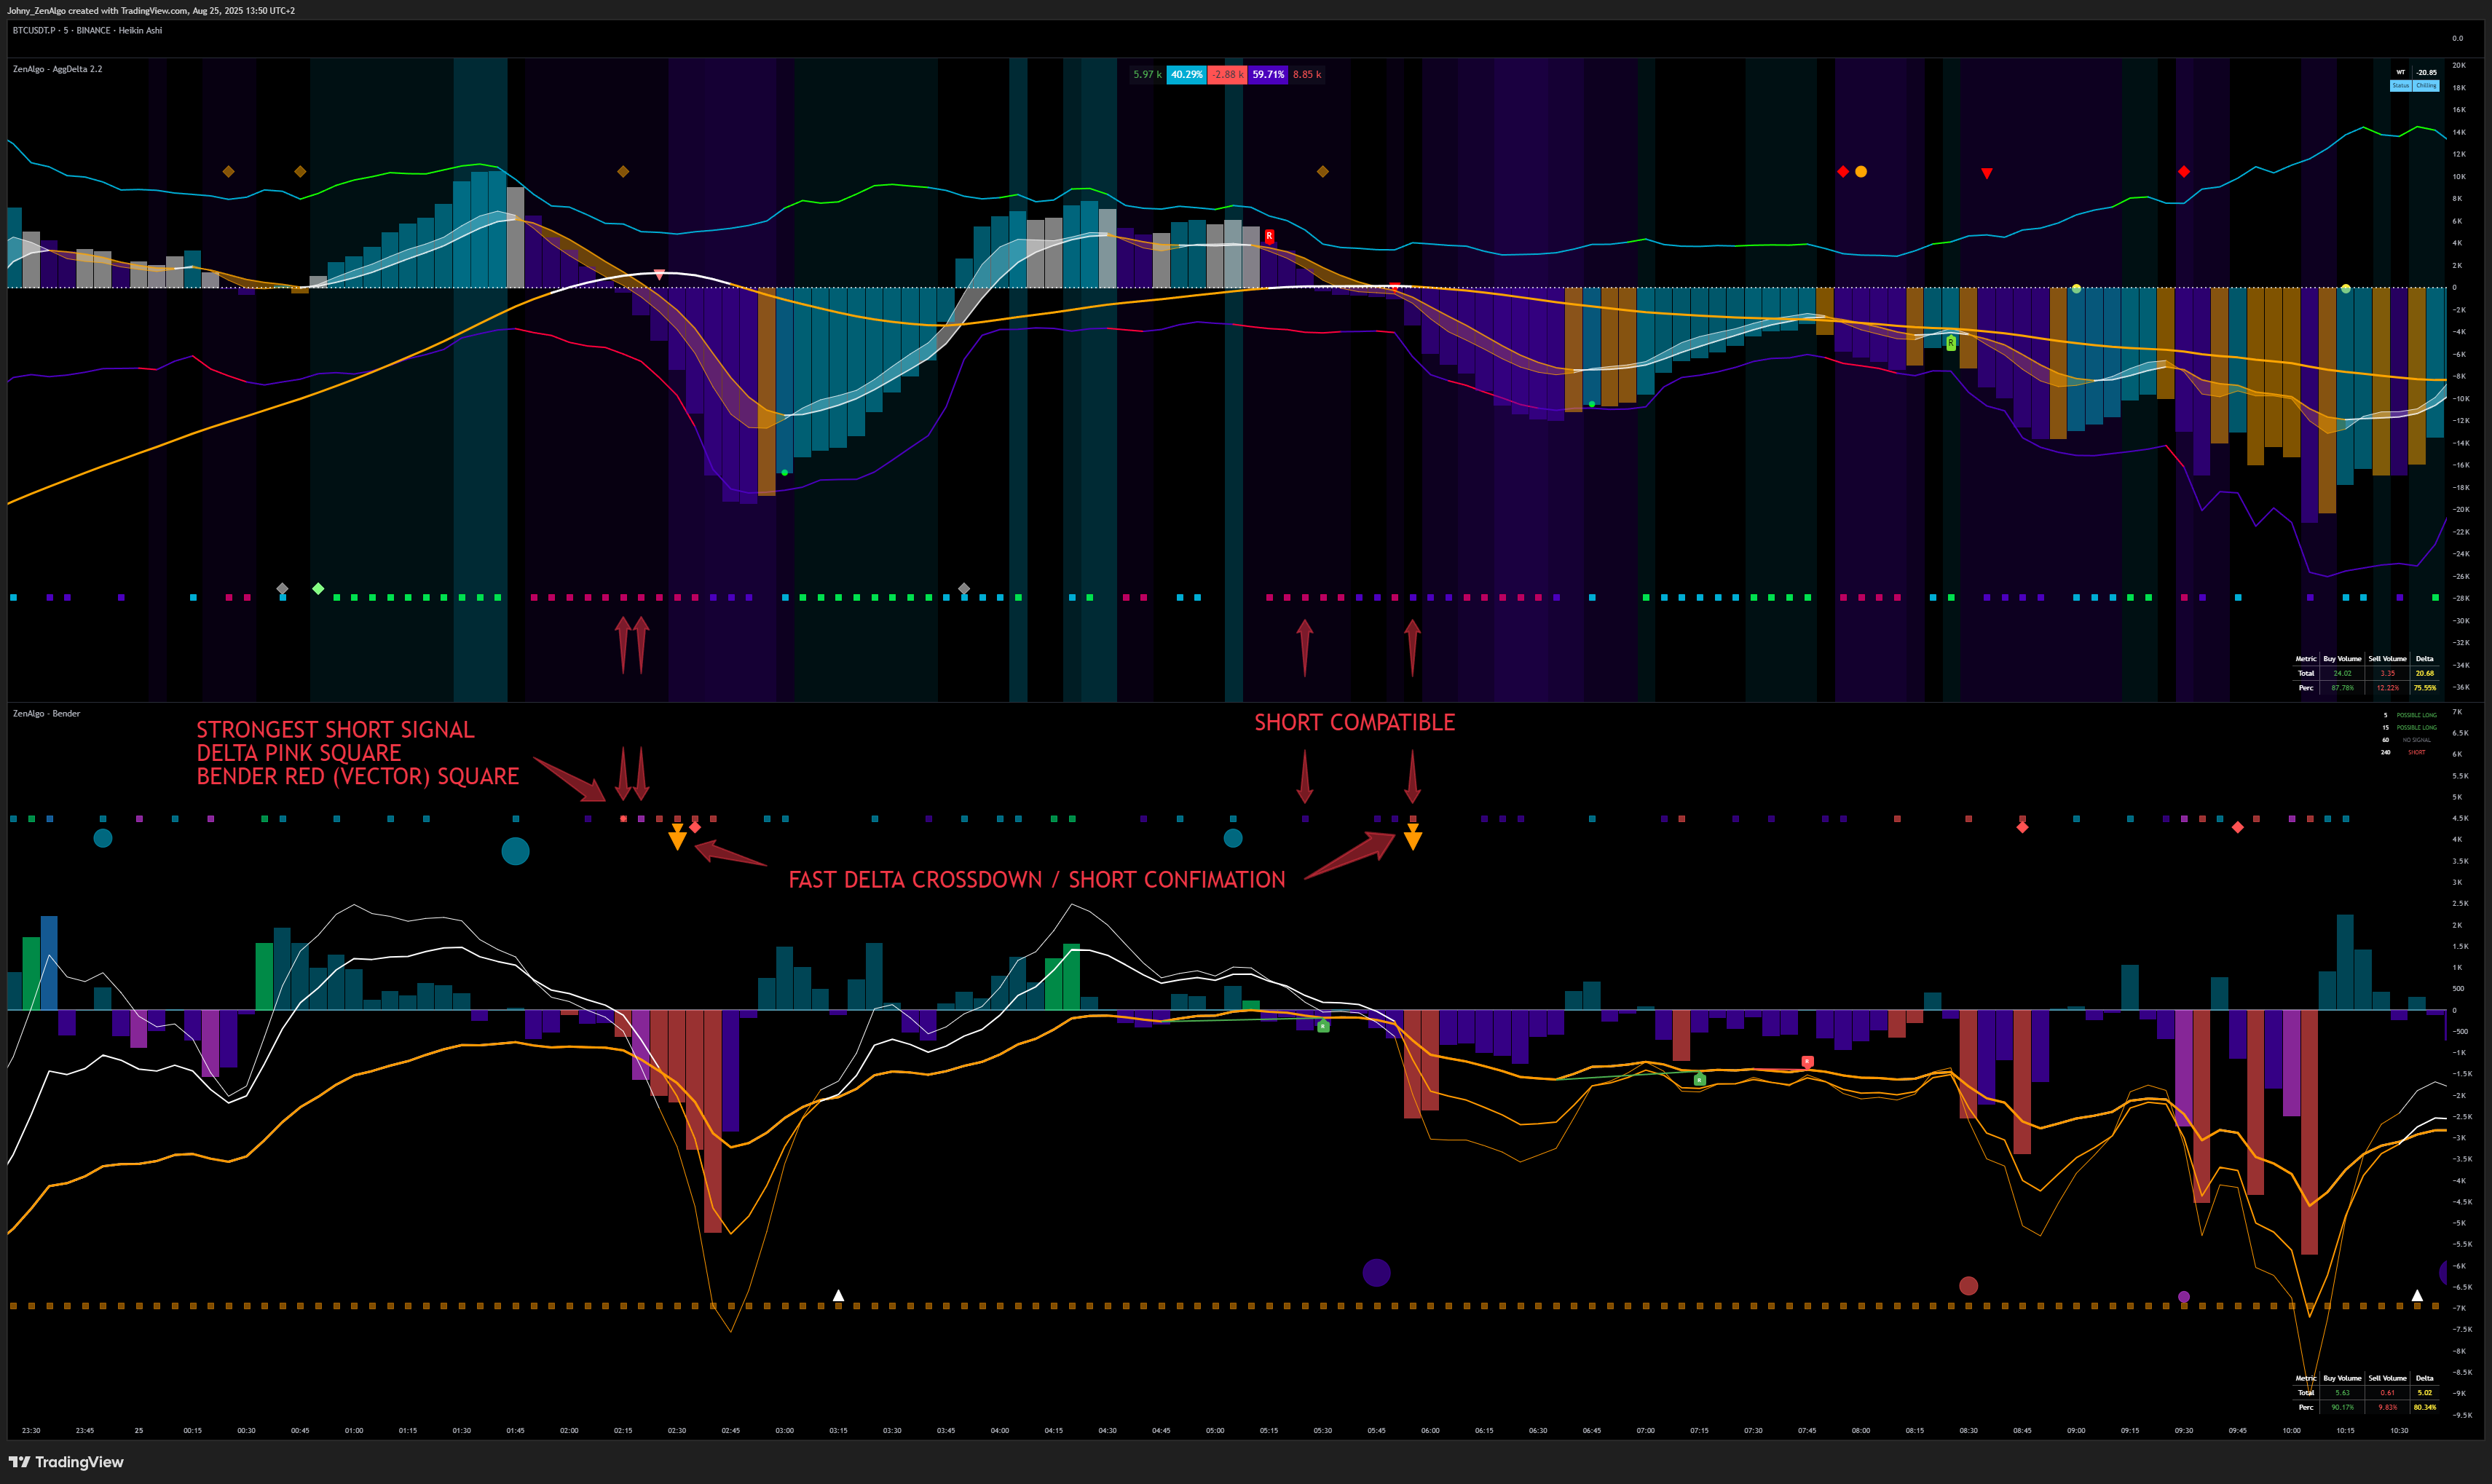
Delta + Bender Confirmation
- Put Delta and Bender indicators under your chart.
- Look for red dots (sell pressure pivots) appearing at the same time on both indicators.
- When Delta and Bender agree, it's strong confirmation of sell momentum.
The Entry Signal
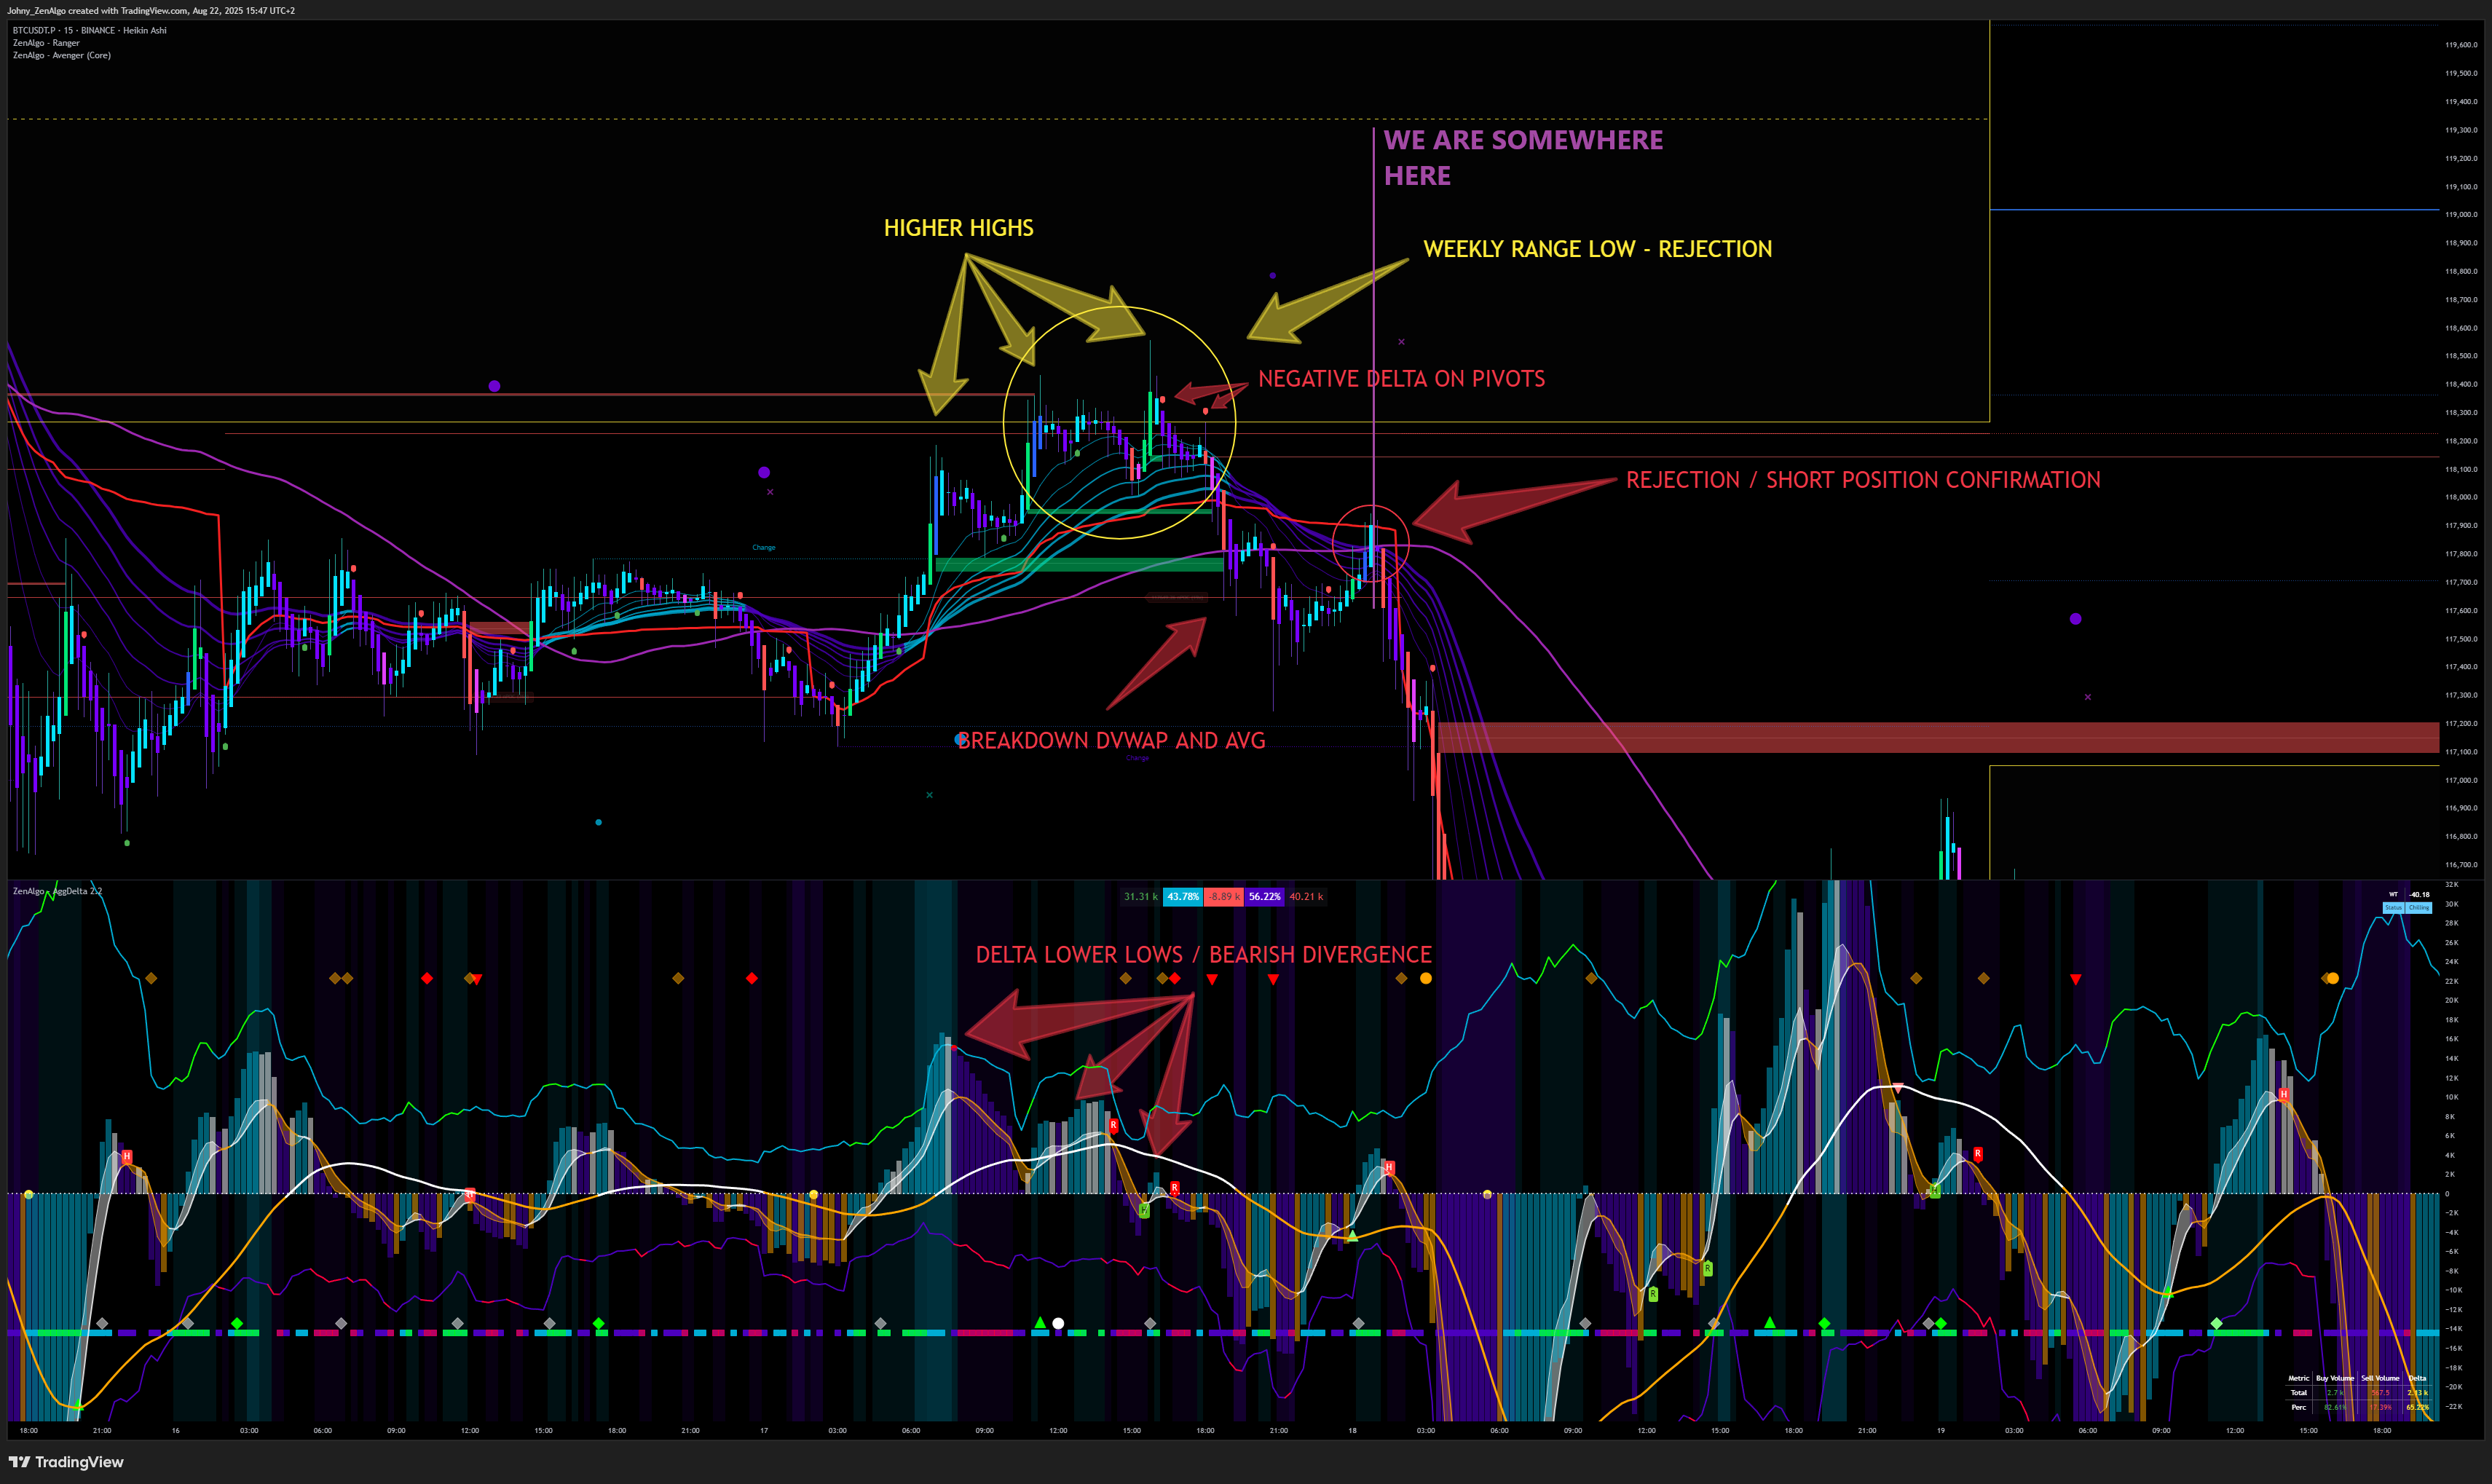
When you see:
- Price rejecting from your mapped level
- AVG broken and retested from below
- Red dots lining up on Delta and Bender
- Optional extra confluence: vector candle rejection
👉 That's your clear signal to enter a short.
But Don't Rush Yet
Even with the entry signal, we still need one more piece:
- Risk/Reward planning → where exactly to place the stop-loss (SL) and take-profit (TP).
Without defined SL/TP, you don't have a valid trade.
We'll cover RRR and trade planning in the next step.
Strategy Step 6: Plan the Trade Before Entry (RRR, SL, TP)
Before you even think about pressing sell, you must already know:
- Where your Stop-Loss (SL) is
- Where your Take-Profit (TP) is
- What your Risk-to-Reward Ratio (RRR) looks like
If you don't have this planned, you are not trading—you are gambling.
Stop-Loss (SL)
Your SL must be logical on the map, not just a random number of ticks away.
Good places for SL:
- Just above the next meaningful level
- Edge of the Ranger box or deviation boundary
- A Multiverse VWAP band beyond your entry
- A prior swing high that invalidates the trade idea
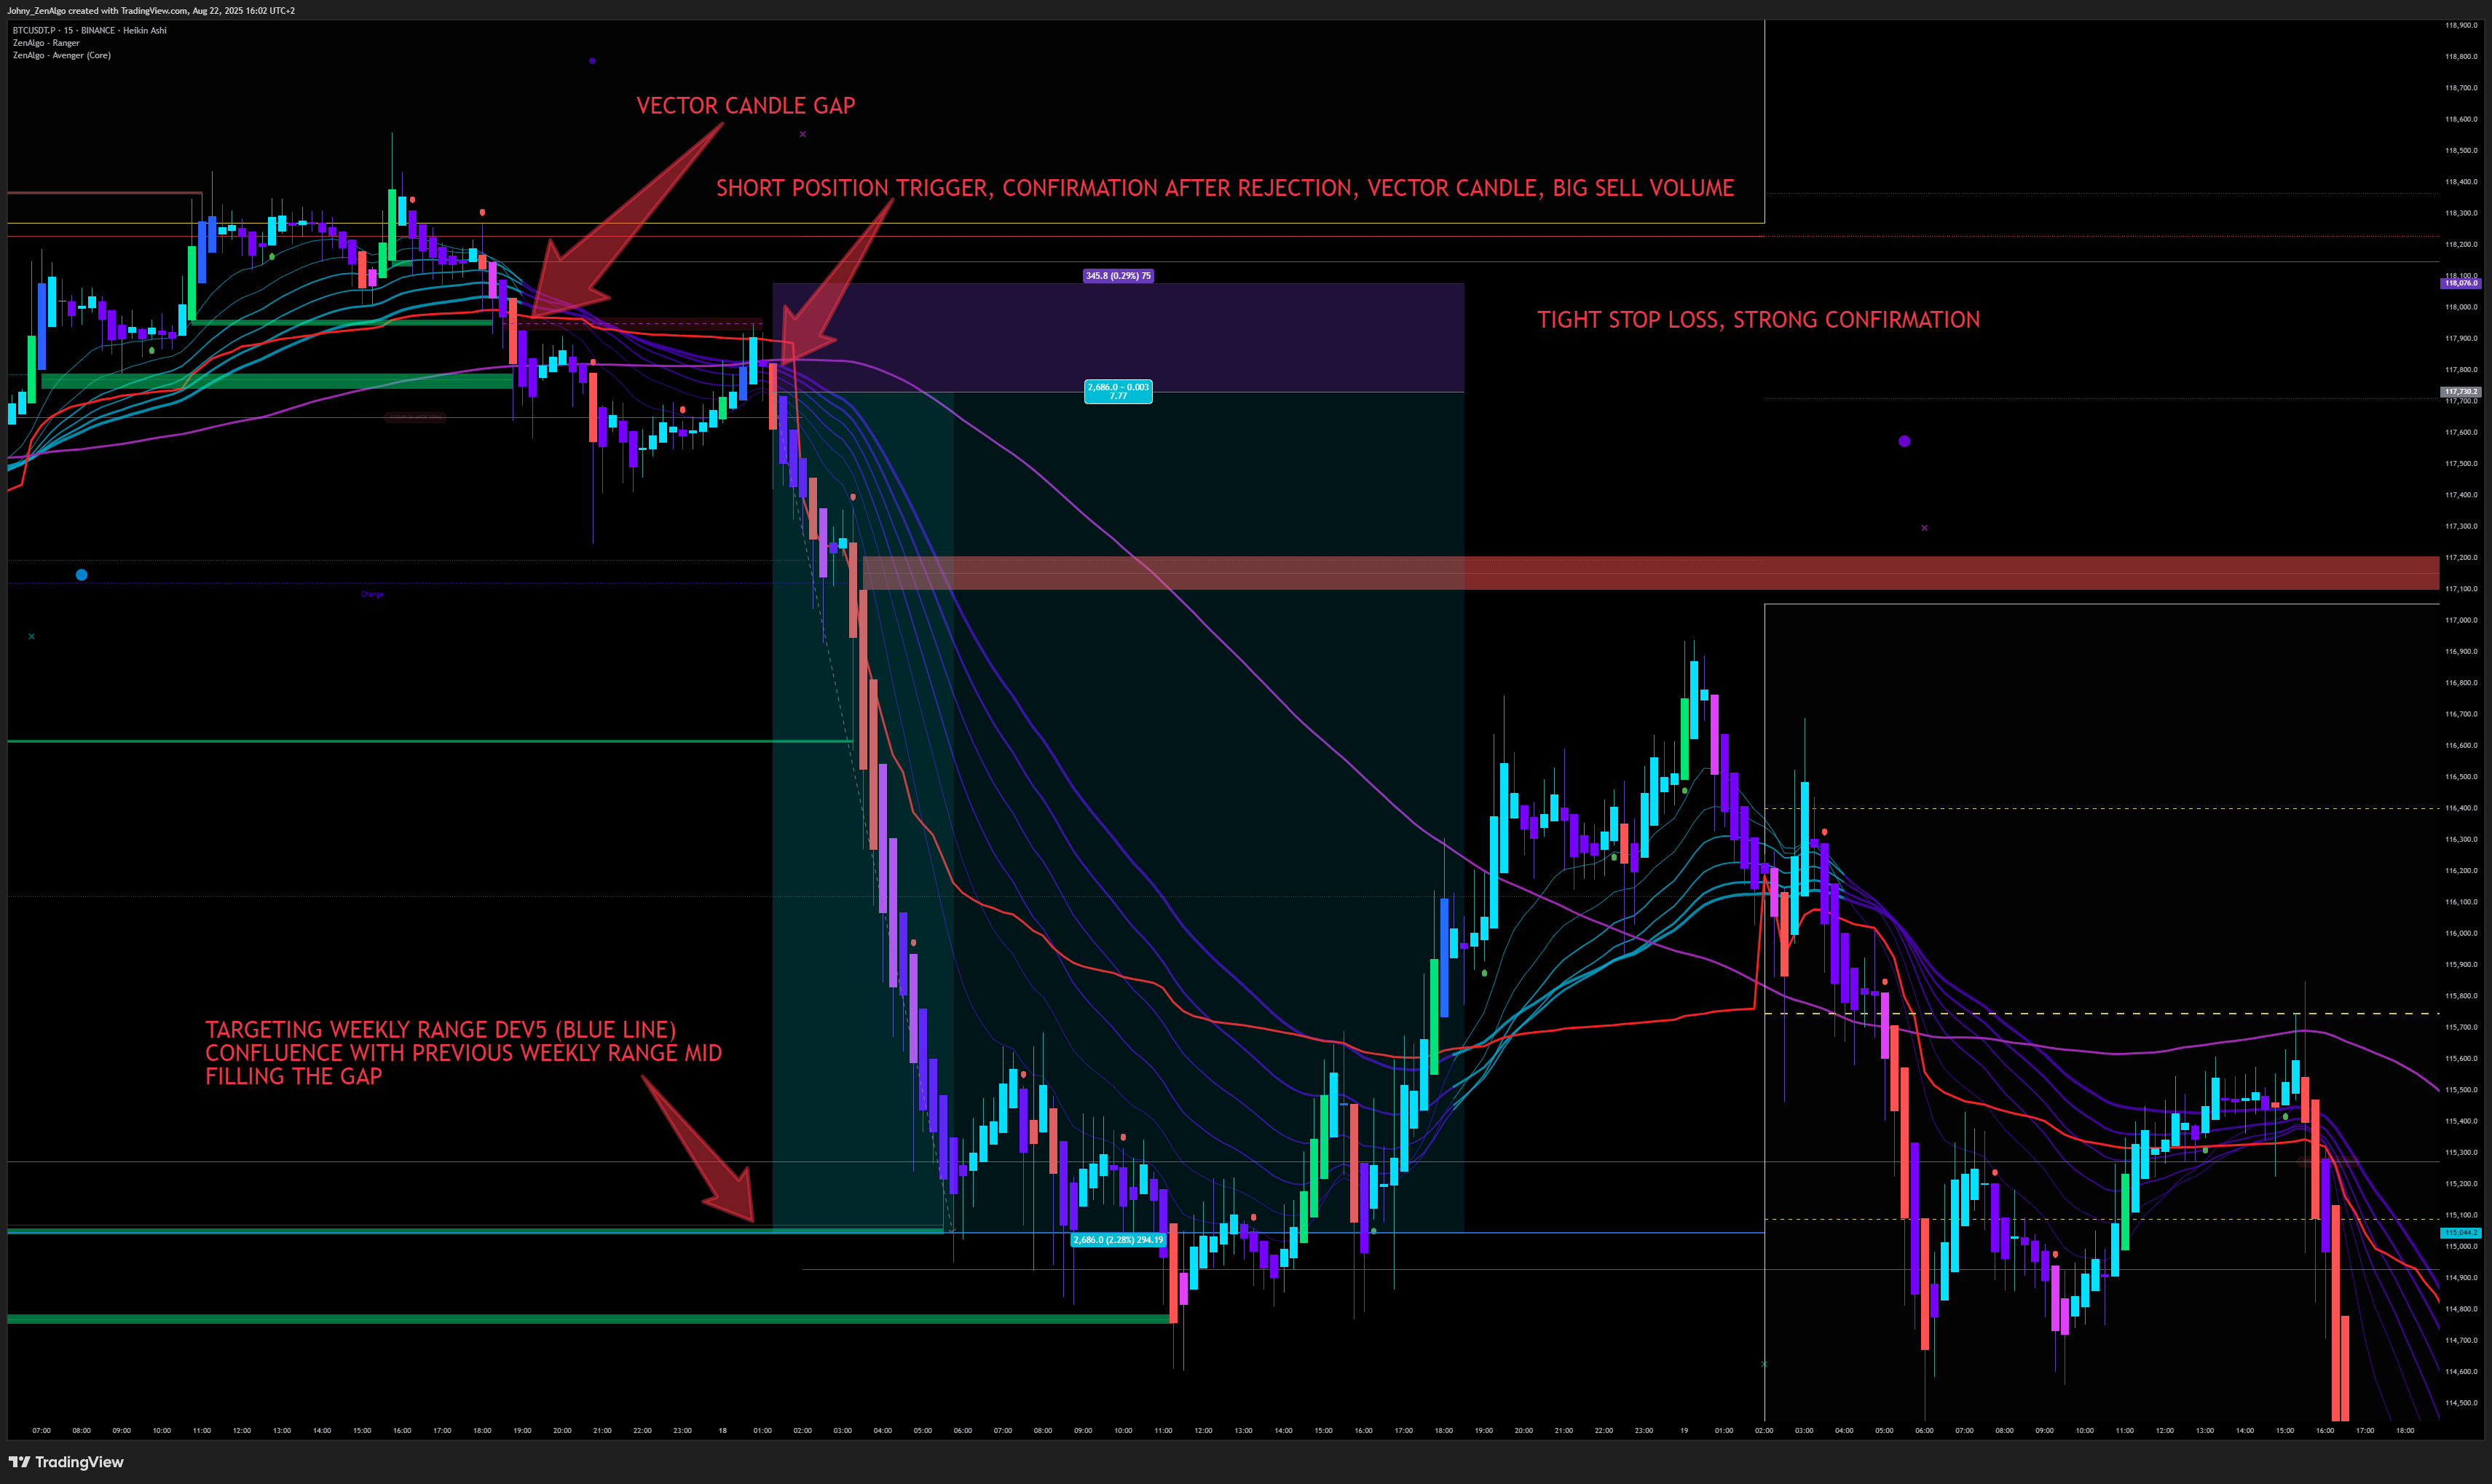
The goal: SL should mark the level where your short thesis is proven wrong.
Take-Profit (TP)
Your first TP also comes from the map.
Strong targets include:
- The next inner level of the range
- Range mid or range low
- A weekly deviation edge
- A range gap fill line
Example: If you short from a rejection at weekly range high, your TP might be the range mid or a prior deviation low.
RRR (Risk-to-Reward Ratio)
Before entry, always check:
- Does the first target give at least 1.5-2R?
- If not, skip the trade—the reward is not worth the risk.
This keeps you focused only on high-quality setups.
Execution Plan
Decide now, before entry:
- Will you take partials at the first TP and let the rest run?
- Or will you go all-out at the first target?
- If the trade runs far in your favor, will you trail the stop behind a VWAP/AVG band?
Having the plan in advance prevents emotional decisions mid-trade.
If you cannot point to the exact SL and TP on the chart before pressing sell,
you are not scalping—you are gambling.
Strategy Step 7: Manage the Open Position
At this stage, you have everything:
- The higher-timeframe downtrend confirmed
- A key level mapped with Ranger
- Bearish divergence on Delta
- Rejection confirmed with Avenger and Bender
- A clear entry with SL and TP
That's enough to stop here.
You could simply let the trade run until it hits SL or TP—and that's a valid way to trade.
But there are also ways to manage the open position. These methods can sometimes protect you, but they can also limit your profits. Like everything in trading, it's about balance and personal preference.
Ways to Manage an Open Trade
-
Early Exit on Warning Signs
If Delta suddenly flips bullish (buying surge) or Avenger prints a clear bullish context at your level, you may decide to cut the trade early.
This reduces losses (or locks small profits) when the market tells you the setup failed. -
Take Partials
Close part of your position at the first mapped level (range mid, deviation, FVG fill, etc.).
After that, you can move your stop-loss to break-even. This way the trade cannot turn into a loss, but you still keep part of the position running. -
Trailing Stop
Instead of a fixed TP, you can trail your stop behind dynamic levels like a Multiverse VWAP band or the Avenger AVG line.
This lets you capture a bigger move if the trend continues strongly. -
Time-Based Exit
Scalps are minutes to a few hours, not days.
If you're still in a position much longer than your timeframe suggests, and there's no fresh confirmation, it's usually best to flatten.
Guideline: How Long to Hold
Here's a rough idea of how long positions typically last on different timeframes:
| Timeframe | Aggressive scalp | Conservative intraday | Swing |
|---|---|---|---|
| 1m | 3-15 min | — | — |
| 3m | 10-45 min | 30-90 min | — |
| 5m | 15-90 min | 45-180 min | — |
| 15m | 45-240 min | 1.5-6 h | — |
| 1h | 1.5-6 h | 3-12 h | 0.5-2 days |
| 4h | 6-24 h | 12-48 h | 2-7 days |
| 1D | — | 1-3 days | 3-10 days |
How to use this:
- If volatility is high, expect shorter holds (targets and invalidations hit faster).
- If the market is trending smoothly, you can hold longer toward the upper bounds.
- Use a time-stop: if nothing happens after 5-8 candles on your chart, consider exiting.
- On perpetual futures, remember funding costs: holding across funding windows without strong confluence often isn't worth it.
The Simple Takeaway
Managing an open trade is about protecting yourself without panicking.
- You can move your SL to break-even once you're in profit
- You can cut a position early if the market clearly flips
- You can scale out in pieces, instead of all-or-nothing
- And you can exit if you've simply been in the trade for too long
👉 The key is to have a plan in advance. Don't improvise mid-trade based on emotions.
Getting into a trade is only half the battle.
Managing it wisely can protect your account, reduce stress, and let you capture bigger moves.
Decide in advance how you will manage your trade—and stick to it.
Conclusion
And that's it—you now know everything essential to apply this strategy.
I strongly recommend you:
- Read this guide multiple times
- Focus especially on areas that feel unclear
- Practice spotting the conditions step by step on historical charts
If something still doesn't make sense, ask freely in our Discord.
You can also leave us feedback there—tell us what could be explained better.
A Final Word of Wisdom
Remember: losses are part of the journey.
Even with all conditions met, the market can still move against you.
- If you took a losing trade, go back to the chart:
- Did you follow every condition of the strategy?
- If not, learn the lesson.
- If yes, then accept it—sometimes the market is irrational.
Your edge lies not in avoiding all losses, but in consistently applying the rules so that, over time, your profits outweigh your losses.
🙏 Thank you for reading. The whole ZenAlgo team wishes you a safe trading journey and plenty of profits ahead.
And remember: statistics are on your side if you stay disciplined.
As a bonus, in the next section you'll find a quick cheat-sheet for fast execution.
Use it as your compact trading companion. 🚀
Core Principles Cheat-Sheet
Use this sheet to remind yourself of the foundations before applying the strategy.
If you forget these, even the best strategy will fail.
⚠️ Disclaimer
- Trading is risky and losses are inevitable.
- Only trade with money you can afford to lose.
- Past performance ≠ future results.
📉 Risk Management
- Never risk more than a small % of your account on a single trade.
- SL and TP must be planned before entry.
- High leverage is not always bad—but only if you fully understand the risk.
- Leverage can also be used to optimize margin, not just to gamble.
- Market can stay irrational longer than you can stay solvent → plan accordingly.
🧠 Psychology & Expectations
- Nobody has a 100% win rate.
- A losing trade ≠ a bad trader.
- Think like a casino → edge plays out only over many trades.
- Losses feel worse than wins feel good → avoid revenge trades.
- Reset: take a break, walk, learn, don't stare at charts 24/7.
- Don't force trades just to “hit daily quota.” No opportunity = no trade.
- FOMO = red flag. If you feel FOMO, step away.
📍 Core Trading Principles
- Always use Heikin Ashi candles (cleaner structure).
- Watch vector candles → strong clues when levels break.
- Avoid trading during major news events → too much randomness.
- Don't long into ATHs (all-time highs). Pullbacks/retests are safer.
- Base your charting on Binance Perpetual (BTCUSDT.P) for the cleanest data, if trading crypto.
- Use the Domina index → if Domina trends up, alts usually trend down.
- Look for divergences → cornerstone of this strategy.
- Never move your SL/TP mid-trade → define them, then stick to them.
🔎 Divergence — The Cornerstone
- Bearish divergence: price makes higher highs, indicator makes lower highs → sellers gaining control.
- Bullish divergence: price makes lower lows, indicator makes higher lows → buyers gaining control.
- The size matters: small 3-5 candle “divergence” = noise.
- Strong divergence spans clear swing highs/lows across many candles → reliable.
- No divergence = no trade.
✅ Golden Reminders
- ❌ No SL/TP plan = gambling
- ❌ Trading during news = gambling
- ❌ Chasing FOMO = gambling
- ✅ Patience + confirmation = high probability trades
- ✅ Discipline beats emotions, every time
- ✅ Consistency + edge → long-term profitability
LTF Day Trading / Scalping Strategy — Quick Cheat-Sheet
Use this checklist when executing trades.
If any condition is missing → no trade.
📊 Timeframes
- Entries: 3m / 5m (5m = main working chart)
- Confirmation: 15m
- Context / Zoom-out: 1h
🚦 Step-by-Step Execution
Step 1: Higher-Timeframe Context
- Domina index = uptrend (capital leaving alts)
- 1h chart = clear downtrend (below bands, AVG confirmed, no bullish divergence)
Step 2: Build the Map (Ranger, 3m/5m)
- Mark: range high/low, mid, weekly lows, deviations, gaps
- Ask: Where is price now?
- If mid-range → wait; if at edge/level → continue
Step 3: Wait for Key Level
- No forcing trades → set alerts at levels
- Only act when price is at meaningful level
Step 4: Mandatory Divergence (Delta)
- Price = higher high
- Delta = lower high/low
- → Bearish divergence confirmed
- Look for confluence: red Delta/Bender dots, Avenger labels, AVG retest
Step 5: Retrace & Confirmation
- Wait for price to break down and reject from level
- Confirmation = rejection candle, vector through level, or Delta + Bender dots
- Enter only after rejection, not before
Step 6: Plan Before Entry (RRR, SL, TP)
- SL = just above next logical level (Ranger edge, VWAP band, prior swing)
- TP = next mapped target (range mid/low, deviation, FVG/gap fill)
- Check RRR ≥ 1.5-2R → else skip
- Decide: partials vs all-out, trail vs fixed
Step 7: Manage the Trade
- If Delta flips bullish / Avenger prints bullish → cut early
- Take partials at first target, move SL to break-even
- Optional: trail stop behind VWAP/AVG
- Respect time guidance: scalps = minutes-hours, not days
🧭 Golden Rules
- ❌ No Domina uptrend = no short
- ❌ No 1h downtrend = no short
- ❌ No bearish divergence = no trade
- ✅ Always know SL/TP before entry
- ✅ Execute with discipline, not emotion
No plan = no entry.
Stick to the checklist. If one box is empty, skip the trade.
Disclaimer
Trading and investing in financial markets involves significant risk of loss and is not suitable for every investor.
The strategy described in this guide is provided for educational purposes only and does not guarantee profits.
Past performance is not indicative of future results, and no trading setup can eliminate the risk of losses.
By using this guide or any ZenAlgo product, you acknowledge and agree that you are fully responsible for your own trading decisions.
For the full legal disclaimer, please visit: zenalgo.com/legal/disclaimer