ZenAlgo - Advanced Open Interest Indicator
The ZenAlgo - Advanced Open Interest (OI) indicator is a powerful tool designed to analyze real-time Open Interest changes, price trends, and volume dynamics. This unique combination of metrics provides traders with valuable insights into market sentiment, positioning, and liquidity, enabling informed decision-making for both entries and exits. With its customizable visualizations and streamlined interface, this indicator is a must-have for traders seeking a quick yet comprehensive overview of market dynamics.
Key Features
Open Interest (OI) Change Analysis
- Open Interest (OI): Tracks the total number of outstanding contracts in futures or options, offering insights into market activity and sentiment.
- Percentage Change in OI: Highlights whether positions are being opened or closed within the current timeframe.
- Color-coded Display:
- Positive OI change: Green (or ZenAlgo theme colors) for increasing activity and potential price continuation. 📈
- Negative OI change: Red for decreasing market activity. 📉
Open Interest reflects the health of market activity. Increasing OI with price trends often signals strong conviction, while decreasing OI can suggest indecision or consolidation.
Price Change and Trend Detection
- Percentage Price Change: Calculates and displays the price change from the previous period for quick reference.
- Trend Analysis:
- 🟢 Long Enter: Price and OI rising together (new long positions added).
- 🔴 Long Close: Price falling with OI decreasing (long positions closed).
- 🟡 Short Enter: Price falling with OI rising (new short positions added).
- 🟠 Short Close: Price rising with OI decreasing (shorts being covered).
Use Long Enter and Short Enter signals to identify market participants adding positions. These are often indicators of strong trends.
Subframe Volume Analysis
- Up and Down Volume Analysis: Breaks down buy and sell volumes over sub-timeframes, providing intra-candle insights. 📊
- Volume Breakdown:
- Displays total volume percentages for Up Volume and Down Volume.
- Delta Analysis:
- Difference between Up and Down Volume.
- 🟩 Positive Delta: Indicates net buying pressure.
- 🟥 Negative Delta: Indicates net selling pressure.
Positive Delta suggests buyers are in control, while Negative Delta points to sellers dominating. Watch for shifts in Delta to spot potential reversals.
Positions Summary
- Summarizes market positioning based on OI and price changes:
- Positive price & OI change: More longs being opened.
- Negative price & positive OI change: Shorts being opened.
- Price & OI decreasing: Positions (long or short) being closed.
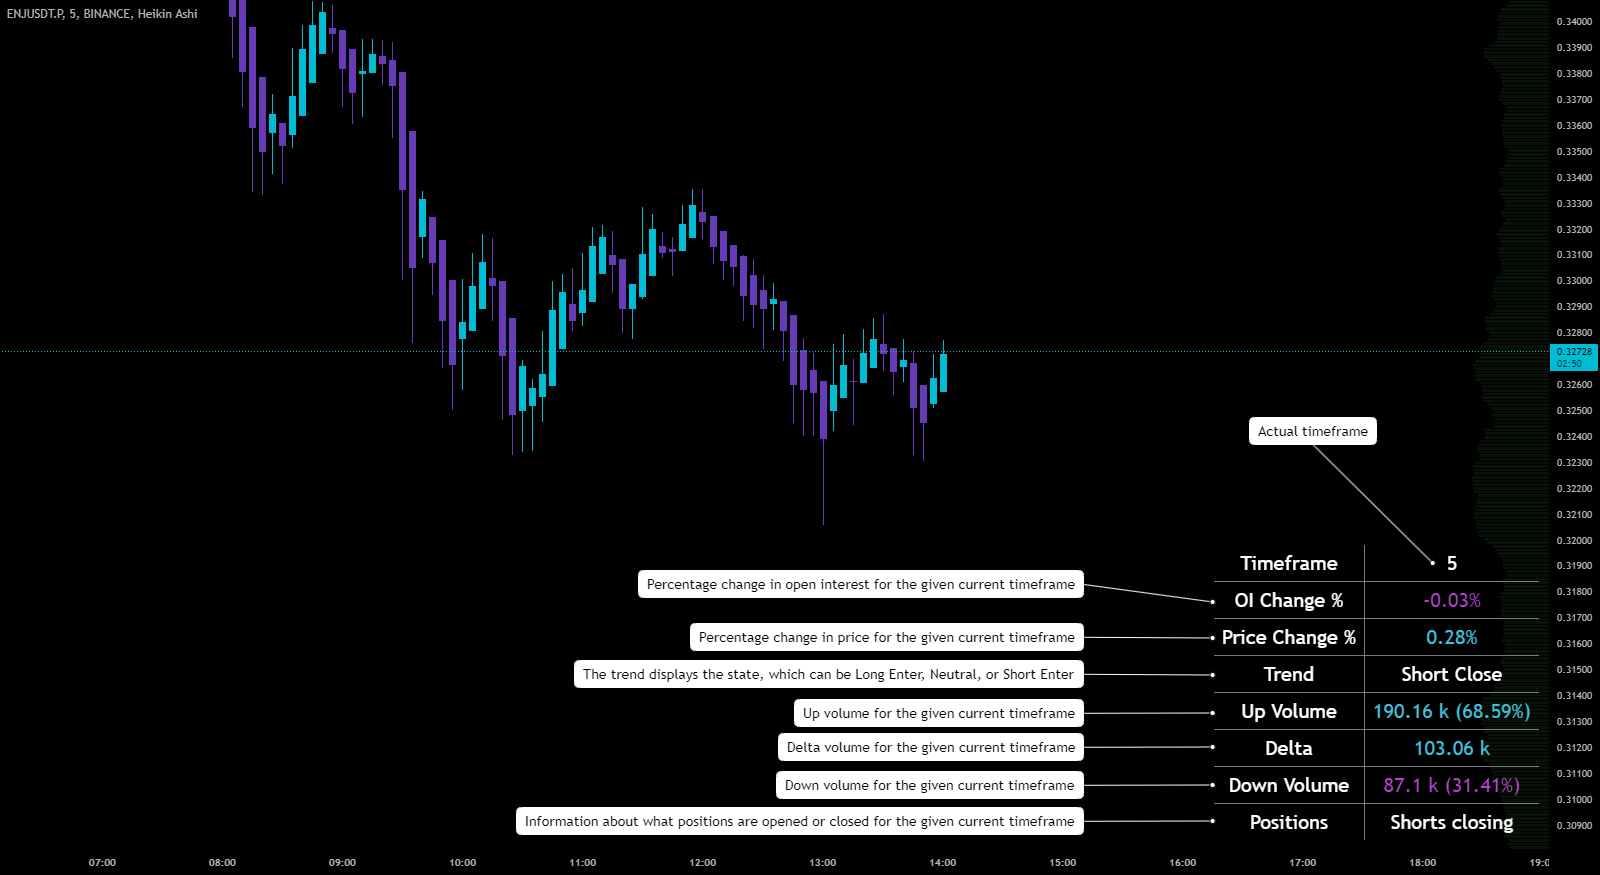
Customizable Dashboard Table
- Visual Dashboard:
- Displays key metrics in an easy-to-read format:
- OI Change (%)
- Price Change (%)
- Trend Status
- Up Volume, Down Volume, and Delta
- Positions Summary
- Displays key metrics in an easy-to-read format:
- Customization:
- Size: Adjust from Tiny to Large.
- Position: Configurable (e.g., Bottom Right, Top Left).
- Themes:
- Dark Mode: Ideal for low-light environments.
- ZenAlgo Theme: A cohesive, professional color scheme.
Customize the table size and position to ensure it doesn't overlap with other indicators on your chart for a clean and clear layout.
Example Use Case
Bullish Scenario
- Situation: Monitoring Bitcoin futures where both OI and price increase over several candles.
- ZenAlgo - Advanced OI classifies this as "Long Enter", signaling strong bullish sentiment. Traders can confidently enter or hold a long position.
Bearish Scenario
- Situation: Price increases, but OI decreases.
- Classified as "Short Close", suggesting a short-term relief rally rather than a sustainable trend. Traders might avoid entering new positions or tighten their stops.
Always correlate OI signals with other technical indicators to ensure you're acting on strong, multi-factor confirmations.
Customization Options
Table Customization
- Size: Options include Tiny, Small, Normal, or Large.
- Position: Configure to avoid overlap with other indicators (e.g., Top Right or Bottom Left).
Themes and Color Options
- Dark and Light Modes: Switchable for visual comfort.
- ZenAlgo Theme: Proprietary colors for a unified and professional appearance.
- Trend & Delta Colors: Choose default or ZenAlgo theme colors for better visibility of key metrics.
Important Considerations
Open Interest Data Quality: Ensure your data provider offers accurate and reliable Open Interest metrics. Poor data quality can lead to incorrect interpretations.
Use Trend Signals like "Long Enter" or "Short Enter" in conjunction with broader market analysis and risk management strategies.
Subframe volume analysis provides deeper insights into intra-candle shifts. This can help you detect early signs of market sentiment changes.
Conclusion
The ZenAlgo - Advanced OI Indicator integrates Open Interest, price trends, volume dynamics, and market positioning into a single, customizable table. It empowers traders by:
- Delivering real-time data for more informed decisions.
- Offering clear insights into market sentiment and dynamics.
- Enabling seamless integration into any trading workflow.
Whether you're a day trader looking for precise entries or a swing trader confirming market trends, ZenAlgo - Advanced OI provides actionable insights at a glance, helping you stay ahead in the fast-paced trading environment.