ZenAlgo - Advanced RSI Indicator
The ZenAlgo - Advanced RSI is a sophisticated tool tailored for traders who want deeper insights into market trends and momentum dynamics. By integrating the classic RSI with features like moving averages, histograms, divergence detection, and advanced trend analysis, this indicator provides actionable signals for both entries and exits. It also highlights overbought and oversold conditions in an intuitive, customizable format.
Key Features
RSI Moving Average
- Choose from various moving average types, including SMA, EMA, WMA, SMMA (RMA), VWMA, and Bollinger Bands.
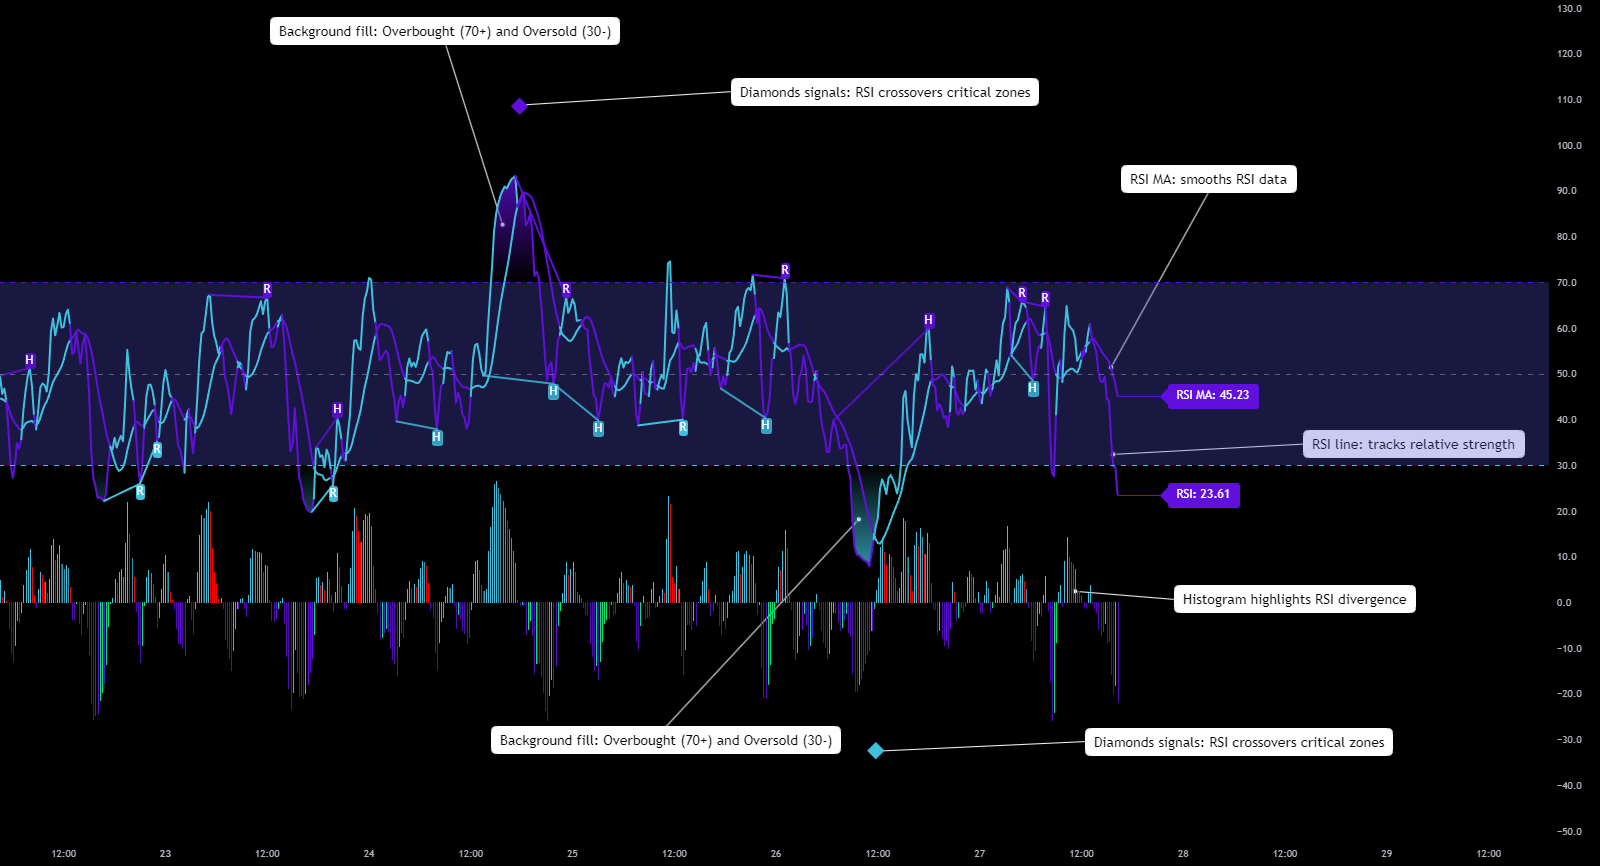
- RSI Moving Average (RSI MA): Plotted alongside RSI to identify key support and resistance levels in market momentum.
Experiment with different moving average types like EMA or VWMA to find the one that best aligns with your trading strategy. Each type has its strengths depending on the market conditions!
RSI Histogram
- Visualizes the difference between RSI and its moving average:
- Green Histogram: RSI above its moving average (indicating buying pressure).
- Red Histogram: RSI below its moving average (indicating selling pressure).
- Color gradients indicate movement strength, helping spot optimal entry/exit points.
Use the histogram to quickly identify shifts in momentum. A transition from red to green can signal a bullish shift, while green to red might indicate bearish pressure.
Bollinger Bands for RSI
- Adds upper and lower bands around RSI when Bollinger Bands are selected as the moving average type.
- Use Case: Highlights market volatility and potential reversal zones as RSI approaches the bands.
Bollinger Bands indicate volatility, not direction. Exercise caution when using them to predict price movements—combine with other indicators for confirmation.
Divergence Detection
- Automatically identifies and labels both regular and hidden divergences:
- Bullish Divergence: Price makes lower lows, while RSI trends upward.
- Bearish Divergence: Price makes higher highs, while RSI trends downward.
- Labels divergences with:
- "R" (Regular): Indicates potential reversals.
- "H" (Hidden): Suggests trend continuation.
Divergences are powerful tools for spotting market weaknesses. Regular divergences are ideal for reversals, while hidden divergences support trend continuation.
Multi-Timeframe Support
- Track RSI levels across different timeframes for comprehensive market analysis.
- Example: Use higher timeframes for macro trends and lower timeframes for precise entries.
Multi-timeframe analysis allows you to align short-term trades with longer-term trends, improving your success rate.
Trend and Sentiment Analysis
- Calculates average RSI values over recent candles to assess trend strength.
- Generates sentiment signals: Bullish, Bearish, or Neutral, to help guide trading strategies.
Diamond Signals
- Diamond Plots: Appear when RSI crosses its RSI MA in overbought (RSI > 70) or oversold (RSI < 30) zones.
- Highlights potential market reversals at critical momentum points.
Diamond signals are most effective in extreme conditions. Combine them with divergences or Bollinger Bands for high-confidence setups.
Fully Customizable Color Scheme
- Adjust the colors for histogram bars, divergences, and moving averages to align with your chart theme and trading preferences.
How to Use This Indicator
Tracking Trends
- Use Case: Monitor the RSI Moving Average and histogram for strength or weakness in market momentum.
- Example: Rising RSI above its MA signals improving strength.
Identifying Entry and Exit Opportunities
- Divergences:
- Hidden Divergence: Suggests trend continuation; ideal for trend-following strategies.
- Regular Divergence: Indicates a potential reversal, often signaling entry/exit points.
Diamond Signals
- Watch for Diamonds: RSI crossing its MA in overbought or oversold zones signals potential reversals, enabling better timing for trades.
RSI Bollinger Bands
- High Volatility Alerts: RSI nearing the bands often precedes reversals or breakouts.
- Example: RSI approaching the upper band suggests potential overextension.
When RSI touches the upper or lower Bollinger Bands, it's not a guarantee of reversal but a warning of increased volatility. Stay alert!
When to Use ZenAlgo - Advanced RSI
Identifying Divergences
- Perfect for spotting market weaknesses or reversals, allowing traders to time their entries and exits effectively.
Supporting Trend Trading
- RSI Bollinger Bands: Monitor for extreme conditions during trends.
- Histogram: Track momentum shifts within trending markets.
Advanced Market Analysis
- A powerful tool for technical traders seeking a deeper understanding of momentum and market sentiment. Best results are achieved when used alongside other indicators.
Important Considerations
No Guarantees: Like all technical indicators, Advanced RSI provides signals based on historical data and should not be used in isolation.
Combine RSI signals with other technical tools and fundamental analysis for well-rounded decision-making. Risk management is key!