Waves - Divergences
The Divergence feature in the ZenAlgo Waves indicator identifies when price action deviates from key indicators, suggesting potential trend reversals or continuations. Divergences are an essential tool for spotting shifts in momentum, and they can signal when price and underlying indicators (like Wave and MoneyFlow) are out of sync.
Types of Divergences
This page covers three primary types of divergences in the Waves indicator:
- Divergences within the Wave Indicator
- Divergences with MoneyFlow
- Combined divergences between Wave and MoneyFlow
Each divergence type is illustrated with visual aids to help you easily identify these patterns on your chart.
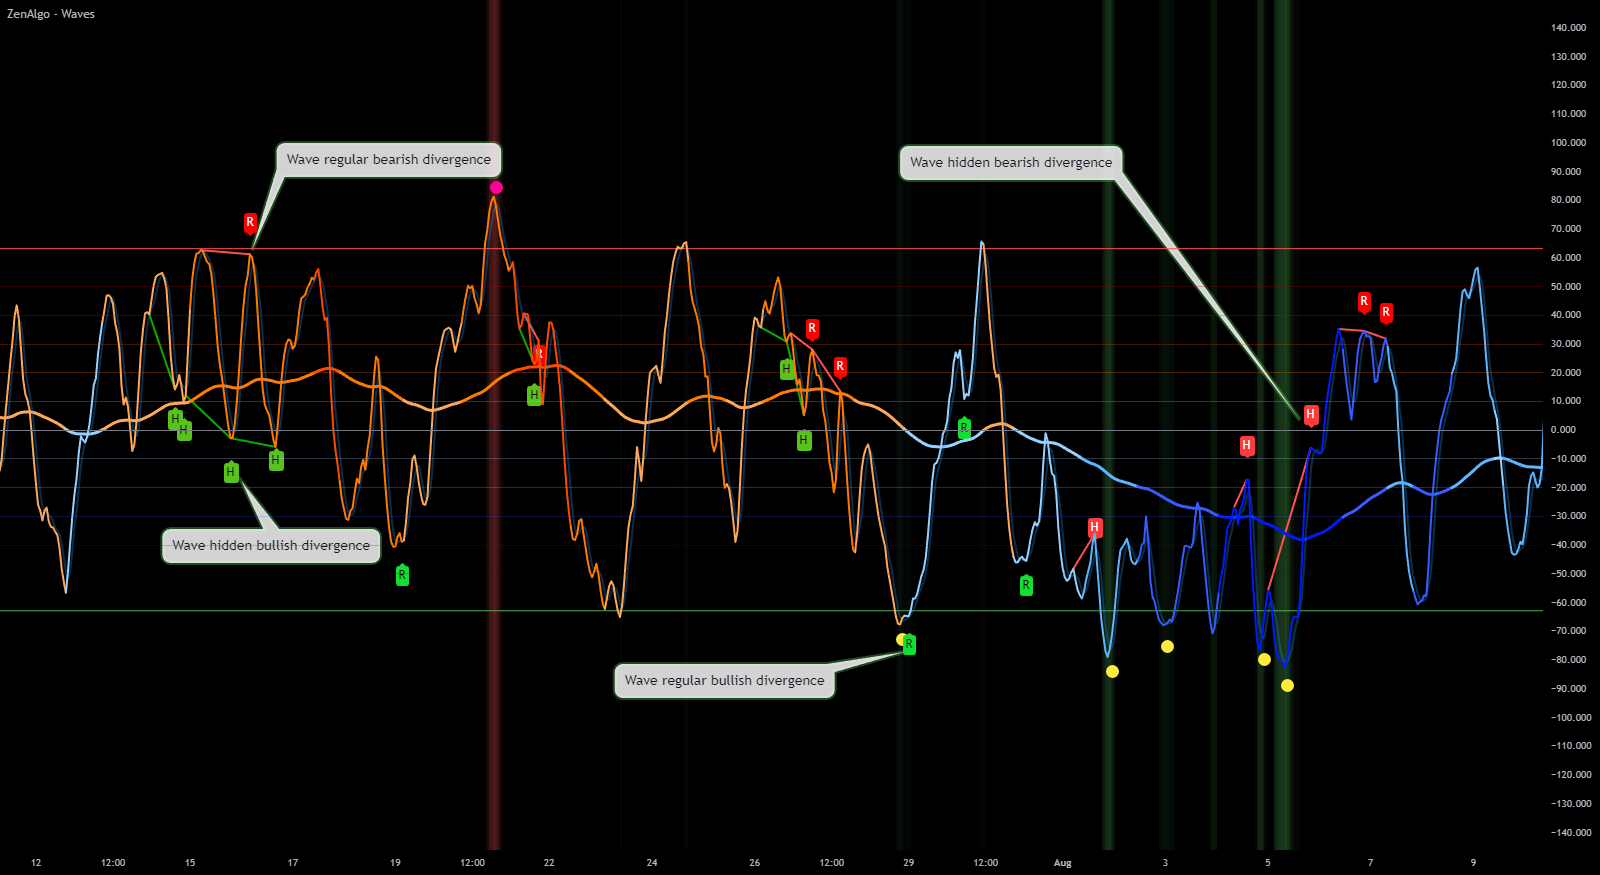
1. Wave Indicator Divergences
The Wave indicator divergences highlight when the Wave line and Signal line diverge over time, indicating potential trend changes. Divergences within the Wave indicator itself are categorized as either bullish or bearish:
- Bullish Divergence: Occurs when price action moves downward, but the Wave line starts trending upward, suggesting that selling pressure is weakening and a reversal may be coming.
- Bearish Divergence: Occurs when price action trends upward, but the Wave line moves downward, indicating that buying momentum is losing strength and a reversal may be near.
How to Use Wave Divergences
- Trend Reversal Signals: Bullish divergences may signal buying opportunities, while bearish divergences could indicate potential sell points.
- Confirm with Other Indicators: Pair Wave divergences with other signals, like support/resistance levels, to confirm trends.
- Monitor Crossovers: Watch for Wave and Signal crossovers following a divergence, as this often confirms the direction.
Wave indicator divergences are particularly useful when spotted in conjunction with key support or resistance levels. For example, a bullish divergence near support increases the likelihood of a successful reversal.
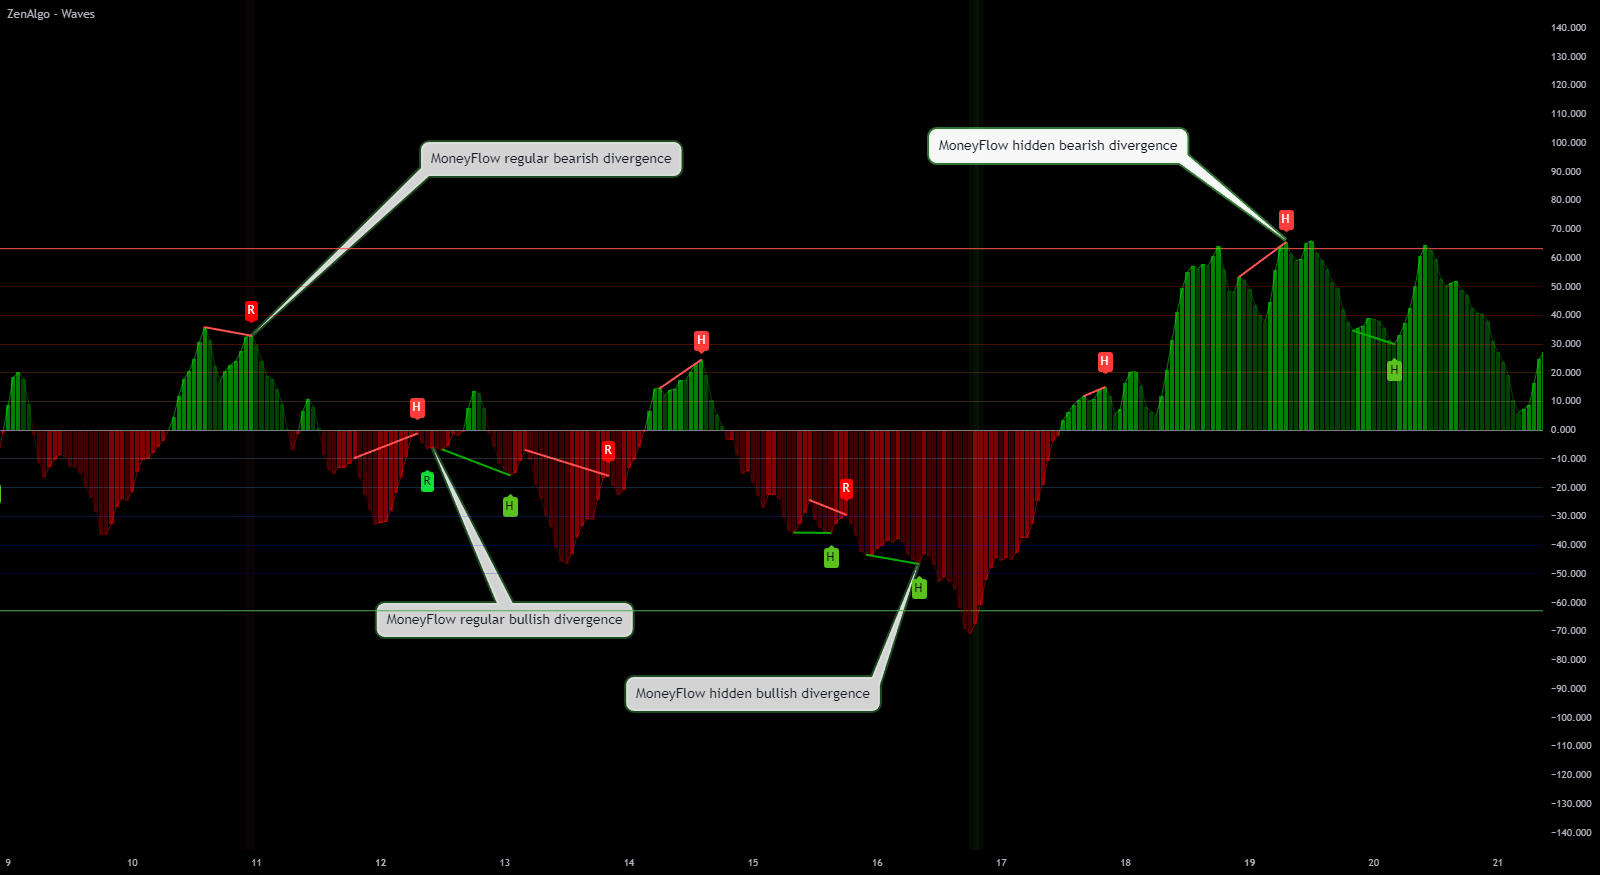
2. MoneyFlow Divergences
MoneyFlow divergences occur when price action moves in the opposite direction of the MoneyFlow indicator. This can suggest a potential reversal, as MoneyFlow indicates whether buying or selling volume is supporting the price move. MoneyFlow divergences are categorized as:
- Regular Divergences: Shown in green (bullish) or red (bearish), regular divergences often indicate trend exhaustion.
- Hidden Divergences: Hidden divergences can signal trend continuation, with green indicating bullish continuation and red signaling bearish continuation.
How to Use MoneyFlow Divergences
- Spot Trend Exhaustion: Use regular divergences to detect when a trend may be losing momentum, signaling potential reversals.
- Confirm Continuation Patterns: Hidden divergences can be valuable for spotting continuation patterns in strong trends.
- Combine with Wave Divergences: MoneyFlow divergences are especially effective when they align with Wave indicator divergences, adding extra weight to the signal.
Regular divergences are excellent for finding potential exits, while hidden divergences work well for confirming entries in trending markets.
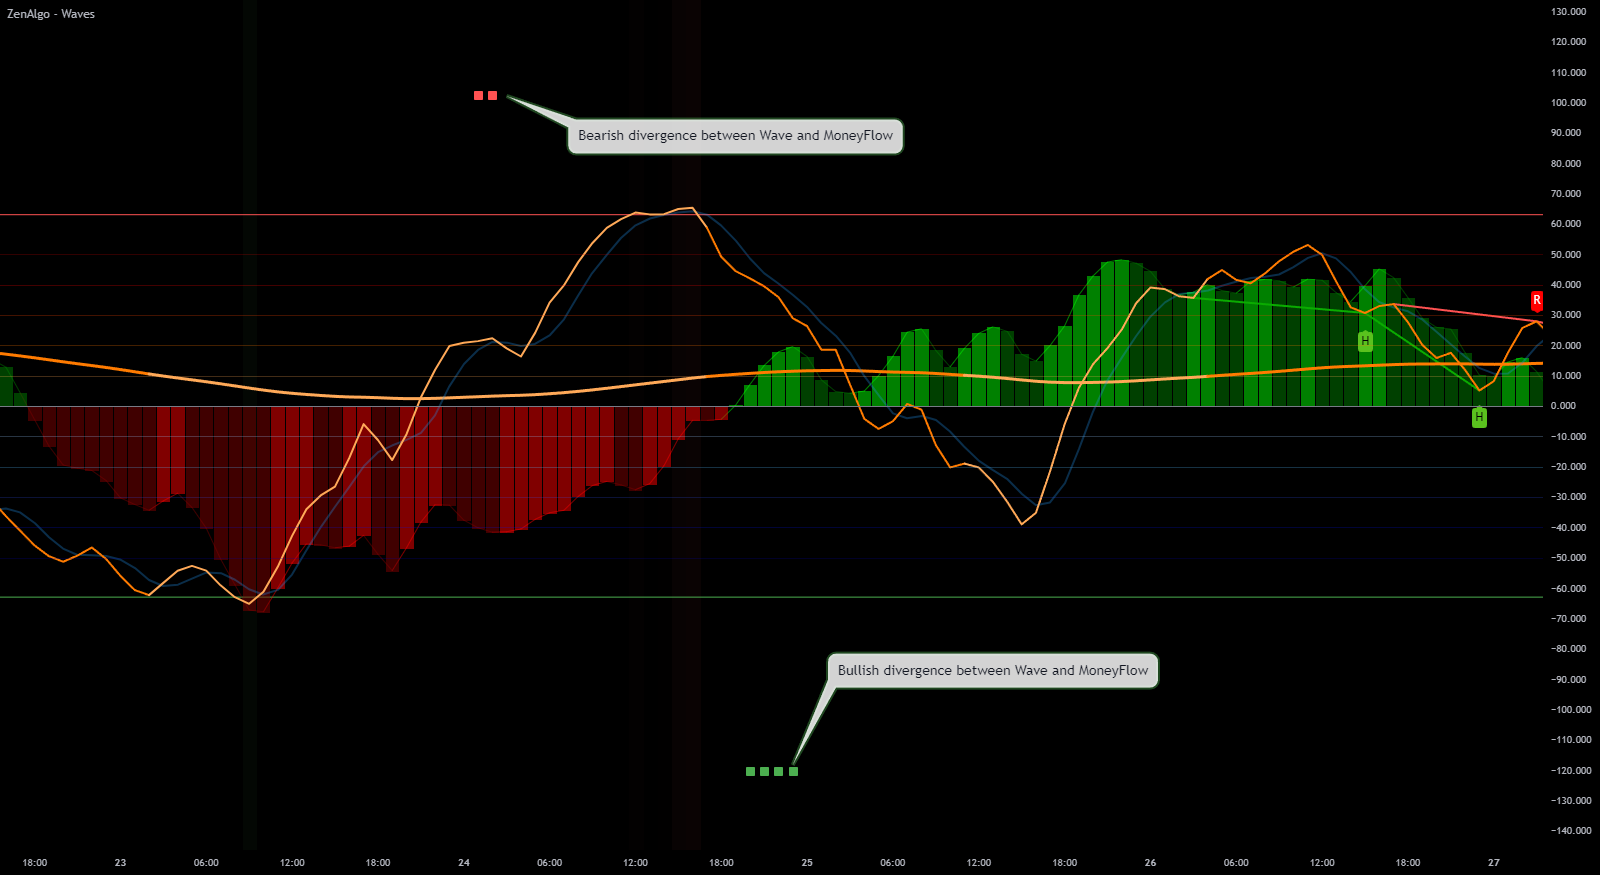
3. Combined Divergences: Wave and MoneyFlow
Combined divergences between the Wave indicator and MoneyFlow are highlighted using square markers, providing a quick visual cue when the two indicators disagree. This can signal areas where a reversal is likely or the trend may be weakening.
- Green Squares: Indicate a bullish divergence, where Wave is signaling upward momentum but MoneyFlow may show declining selling pressure.
- Red Squares: Indicate a bearish divergence, where Wave signals downward momentum while MoneyFlow suggests diminishing buying pressure.
How to Use Combined Divergences
- Identify Weakening Trends: Green squares suggest potential buying opportunities if downward pressure is weakening, while red squares signal selling opportunities if buying pressure is fading.
- Use for Early Reversal Detection: Combined divergences between Wave and MoneyFlow are effective for early identification of trend shifts.
- Check for Repeated Signals: Multiple green or red squares in quick succession often strengthen the divergence signal.
Combined divergences are powerful signals when aligning with key price levels. Green squares near support or red squares near resistance often reinforce reversal potential.
Summary of Divergence Signals
- Wave Divergences: Identify shifts in momentum by watching for divergences between the Wave and Signal lines.
- MoneyFlow Divergences: Spot when volume and price direction diverge, using regular divergences for reversals and hidden divergences for continuation.
- Combined Divergences: Use square markers to detect disagreement between Wave and MoneyFlow, which can signal potential reversals.
Each divergence type adds unique insights, helping you make informed trading decisions based on the alignment (or lack thereof) between price action, momentum, and volume.