Heavy Delta - Daily Open Indicator
The Daily Open is the price level at which the market "opened" for the day. By marking this point on the chart, traders gain a baseline reference for all subsequent price movements during that day. It allows for a quick understanding of whether the market is trading above or below the starting price of the trading session.
How It Works
1. Identifying the Daily Open
At the start of a new day (based on the chart's time settings), the indicator records the opening price. For example, this occurs at 00:00 (midnight) on most charts.
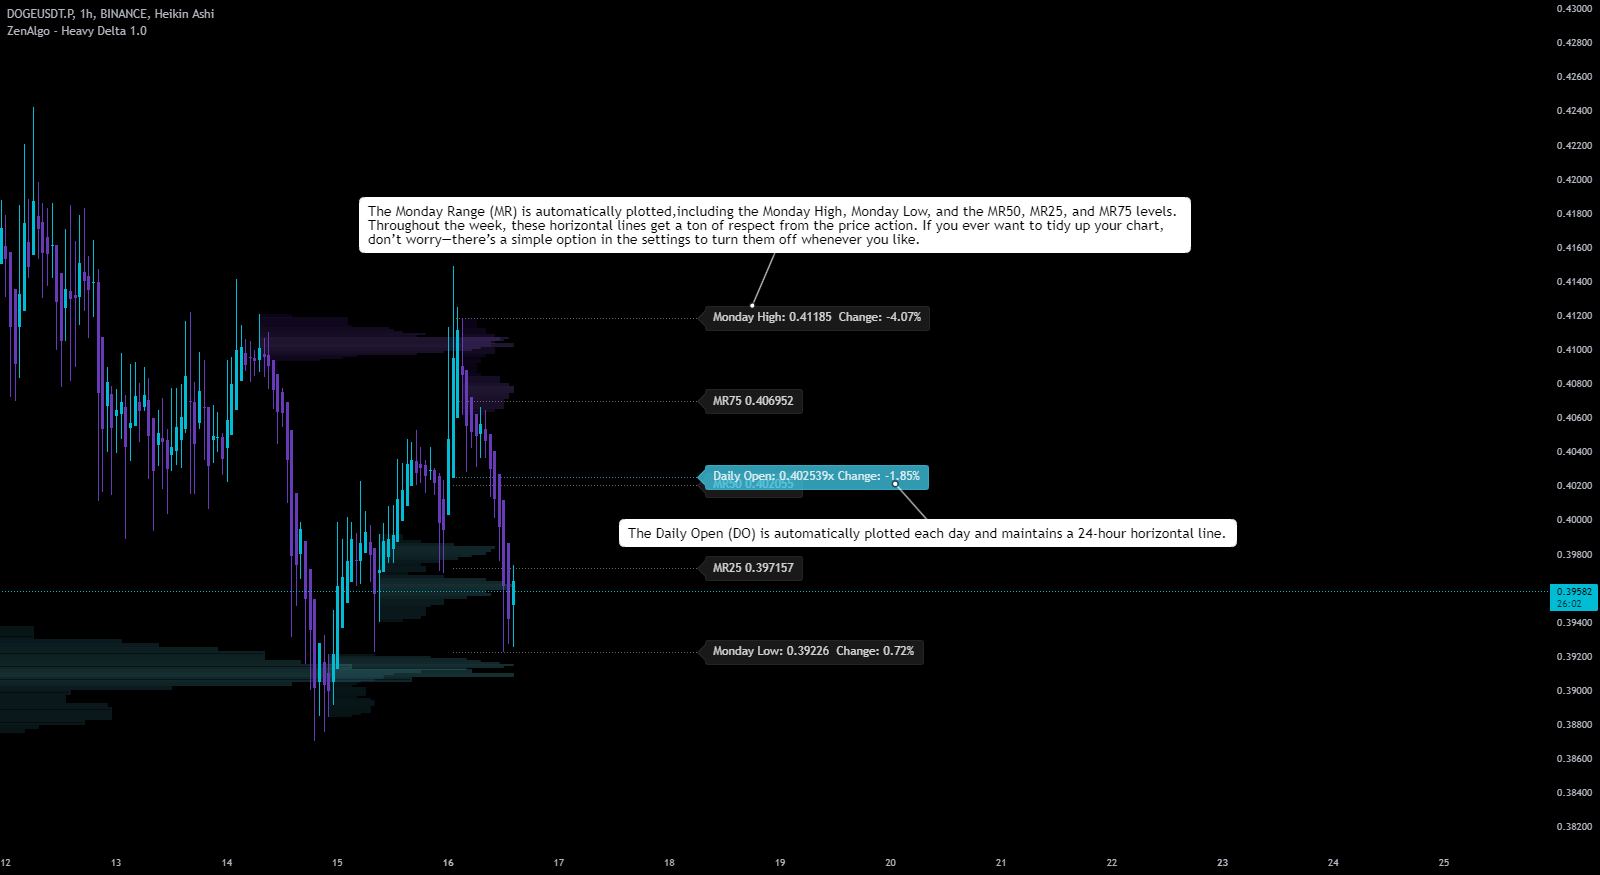
2. Drawing a Line and Label
- A horizontal line is drawn at the daily open price.
- A label, such as "Daily Open: [Price]," is added to highlight this level.
- The line and label extend forward throughout the trading day, offering an easy visual reference.
3. Calculating Percent Change
As the day progresses, the indicator computes the percentage difference between the current price and the daily open price. This real-time metric helps traders quickly assess whether the price has risen or fallen since the open.
Why is it Useful?
Baseline for the Day
The daily open acts as a simple benchmark:
- Above the line: Indicates the market is performing better than where it started.
- Below the line: Suggests the market is weaker compared to its opening level.
Quick Market Bias
The daily open helps traders gauge sentiment:
- Struggles to break above the line may indicate caution or bearish sentiment.
- Holding above the line often reinforces a bullish outlook for the session.
Reference for Intraday Strategies
The daily open is frequently integrated into trading strategies:
- Long trades: Considered when the price remains above the daily open.
- Short trades: Favored when the price stays below.
- It serves as a clear, time-based pivot point for decision-making.
Customizations and Features

Visibility Control
- Toggle options allow you to hide the daily open line and label if desired, keeping your chart clutter-free.
Alerts
- Set alerts to trigger when the price crosses the daily open. This feature ensures you're notified of key market movements in real time.
Integration with Other Indicators
The daily open is a versatile tool that pairs well with other indicators:
- Combine it with moving averages to identify trends.
- Use volume analysis to confirm momentum during key levels.
- Pair with oscillators to detect overbought or oversold conditions near the daily open.
For instance, a breakout above the daily open line with rising volume could indicate strong bullish momentum.
- Regularly Analyze Sentiment: Use the daily open to check how sentiment evolves throughout the session.
- Combine with Context: Always evaluate the daily open alongside broader market conditions and other technical tools.
- Set Alerts Wisely: Alerts can help you stay proactive and reduce the need for constant monitoring.
In Summary
The Daily Open Indicator provides a simple yet powerful benchmark for tracking intraday market behavior. By continuously displaying the starting point of the trading day, it gives traders real-time insights into market direction and strength. This makes it a valuable tool for day traders or anyone seeking clarity on short-term market trends.