Heavy Delta - Monday Range Indicator
The Monday Range represents the highest and lowest prices achieved during Monday's trading session. These levels often serve as critical reference points for the rest of the week, helping traders gauge the market's initial direction.
Key Insight:
- Above Monday's High: Indicates bullish momentum or strong upward sentiment.
- Below Monday's Low: Signals bearish momentum or weaker market conditions.
How It Works
Identifying Monday's High and Low
- Starting after a specific time on Monday (e.g., 2:00 AM GMT), the script tracks all price bars within Monday's session.
- It continuously updates and stores the highest and lowest prices reached during this period.
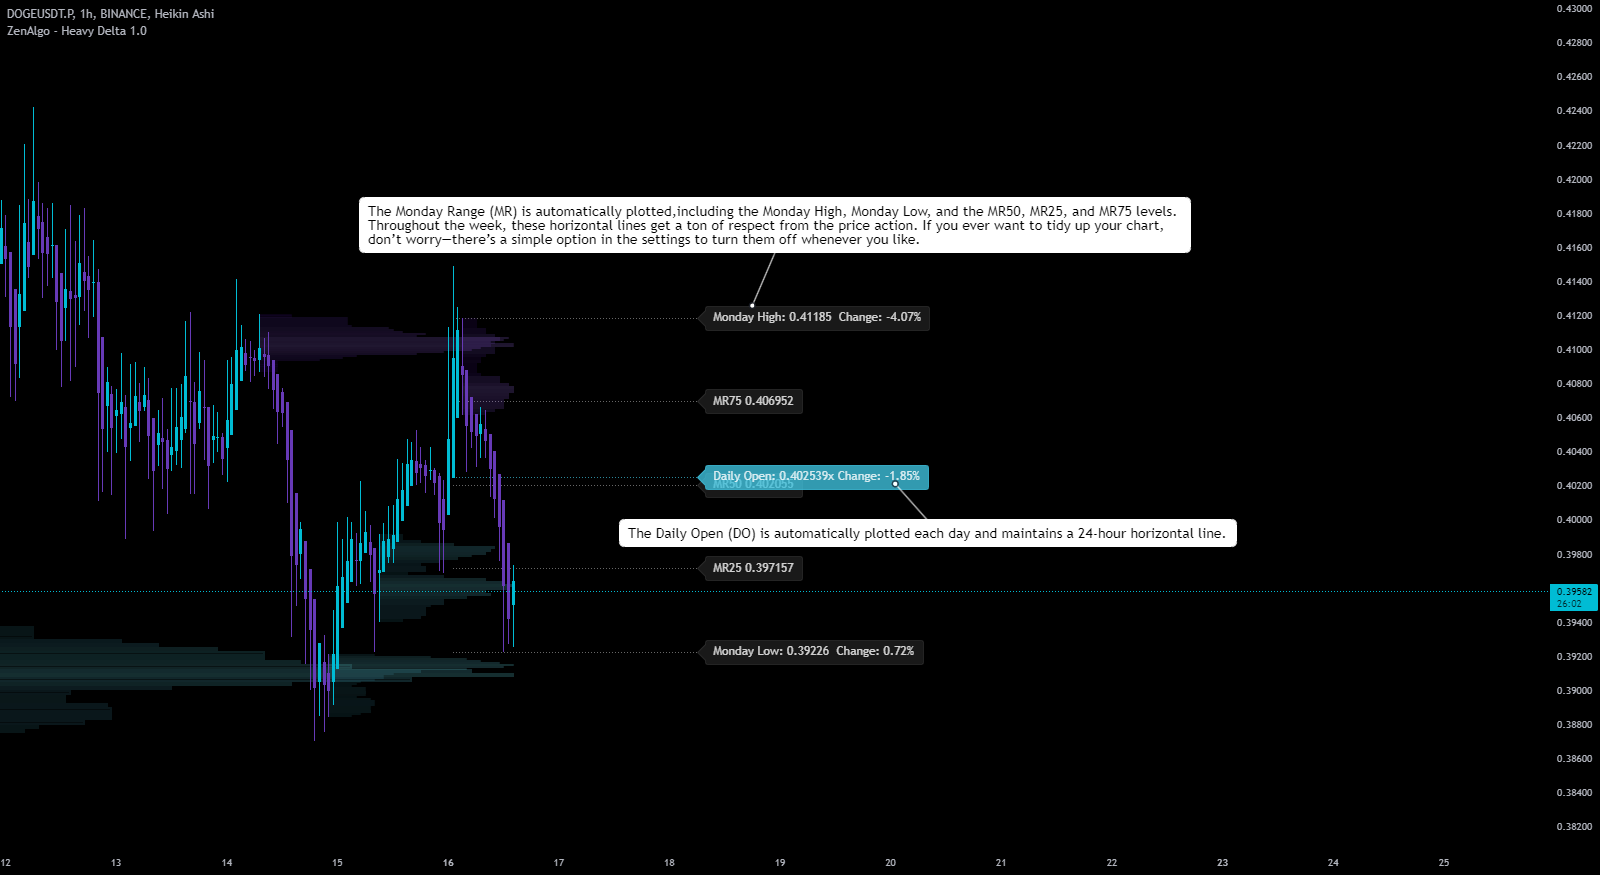
Drawing Lines and Labels
- Horizontal dotted lines mark the Monday High and Monday Low levels.
- Labels like "Monday High" and "Monday Low" appear on the right side of the chart for easy reference.
- These lines extend forward in time, allowing you to compare current price action with Monday's range.
Intermediate Levels (25%, 50%, 75%)
- The range between Monday Low and Monday High is divided into quarters.
- Lines at 25%, 50%, and 75% levels are plotted with corresponding labels.
- These subdivisions help identify potential intraday support/resistance zones within the broader Monday range.
Why is it Useful?
Reference Points for the Week
The Monday Range acts as a baseline, offering a clear starting point to interpret the market's weekly development. Price action near these levels later in the week can indicate shifts in market sentiment.
Support & Resistance
- Monday High and Monday Low frequently act as key support/resistance zones.
- For example:
- Price bounces off Monday Low: Potential support.
- Struggles to break Monday High: Possible resistance.
Trade Planning
- Traders can structure strategies around these reference points:
- Breakout above Monday High: Signals bullish continuation.
- Breakdown below Monday Low: Indicates bearish momentum.
Contextualizing Other Indicators
Pair the Monday Range with tools like:
- Moving averages for trend confirmation.
- Volume analysis to confirm strength or weakness at range boundaries.
- Oscillators to spot overbought/oversold conditions near Monday levels.
Possible Customizations
Adjusting Visibility
Toggle the visibility of Monday Range lines and labels to keep your chart clean.
Timeframe Adjustments
Modify the logic to track ranges for different days or set a custom start time.
Alerts and Notifications
Set alerts for price movements beyond the Monday High or Low, ensuring you're notified of potential trade setups.
- 🔄 Review Weekly Bias: Use the Monday Range to gauge sentiment shifts throughout the week.
- 🧩 Combine with Other Tools: Add context by analyzing the range alongside your favorite indicators.
- 🔔 Set Smart Alerts: React quickly to price breaking critical levels without constantly monitoring the chart.
In Summary
The Monday Range Indicator provides a clear weekly framework for traders. By marking Monday's High, Low, and intermediate levels, it simplifies market analysis and improves decision-making. Whether you're planning trades or assessing sentiment, this tool offers valuable insights into the market's weekly dynamics.